
Dow turns sideway ?
Price Movement The Dow’s daily chart shows a period of consolidation within a defined upward channel. The asset recently experienced a pullback from its highs near 45,000, correcting to the lower boundary of the channel. The price now hovers around the 42,969 mark. The candlestick patterns suggest minor indecision, reflecting in the recent shadows both […]

Dow 1h
⚠️ 通知 1小時圖 技術指標 / 形態 1 阻力 43560 2 短線支持 42250 3 主要支持 41700 *所有技術觸發將即時發送到 Telegram 頻道
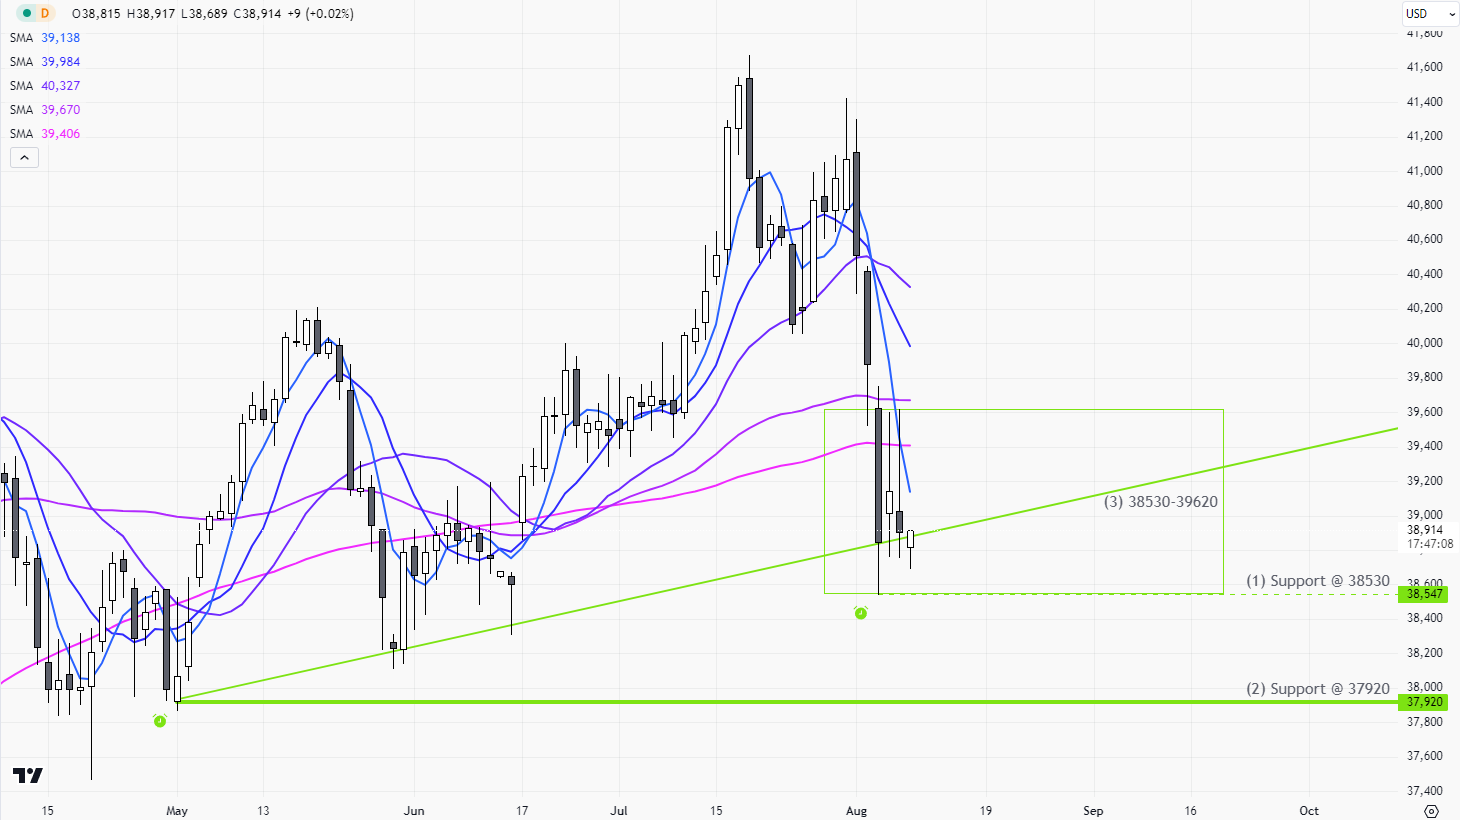
Dow
???? 通知 日線圖 技術指標 / 形態 1 支持 38530 2 主要支持 37920 *所有技術觸發將即時發送到 Telegram 頻道