Edit Content

Gold Trend 30/03

Home  Gold Trend 30/03

Gold Trend 30/03

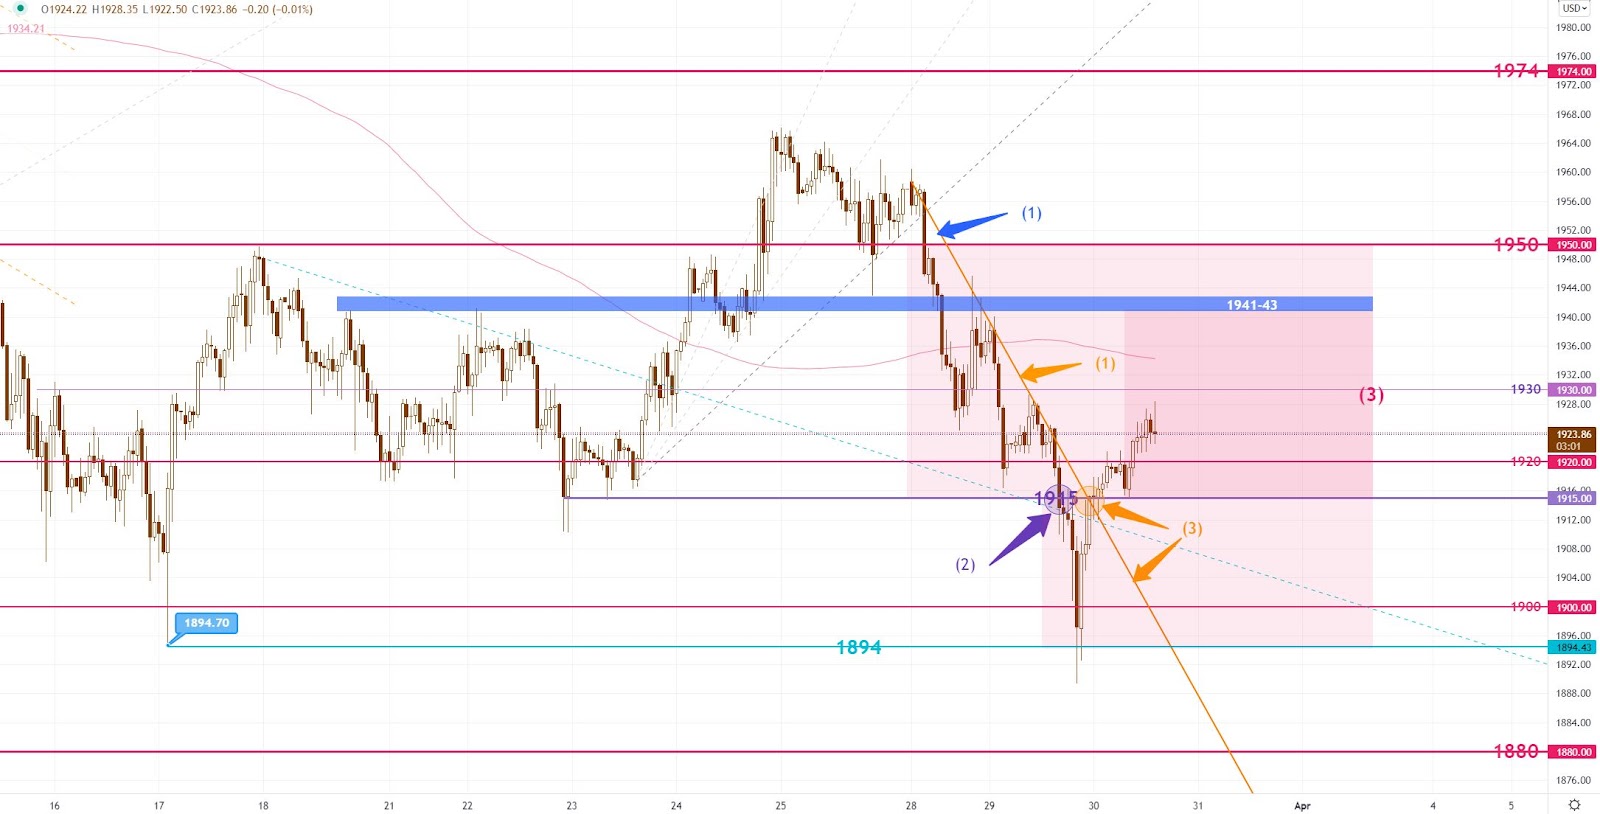
Gold rallied from the 2-week low yesterday. Carried the selling momentum from the day before, the price was under pressure by the S-T resistance line(1) throughout the day, and the fall has accelerated once it broke the 1915(2) support at the European session. The rebound began after the price had touched the 2-week low, 1989, at the US session opening. The day ended at 1918, down slightly by USD 4.


While the Russia-Ukraine peace talk is in progress, the gold price has weakened in the past 48 hours. The price touched 1889 yesterday, but the buying around 1900 is still strong, where the price can only stay below 1900 for no more than 2 hours. The downtrend originated on Monday ended yesterday as the price has broken out from the S-T resistance line(3). Gold is now resuming its position above 1920; gold is now back to the range of 1915-40(3). Expect the bullish momentum to continue today, potentially touching the upper resistance of the range near the 1940 level. On the other hand, pay close attention to the Russia-Ukraine peace talk, which may trigger sudden selling.


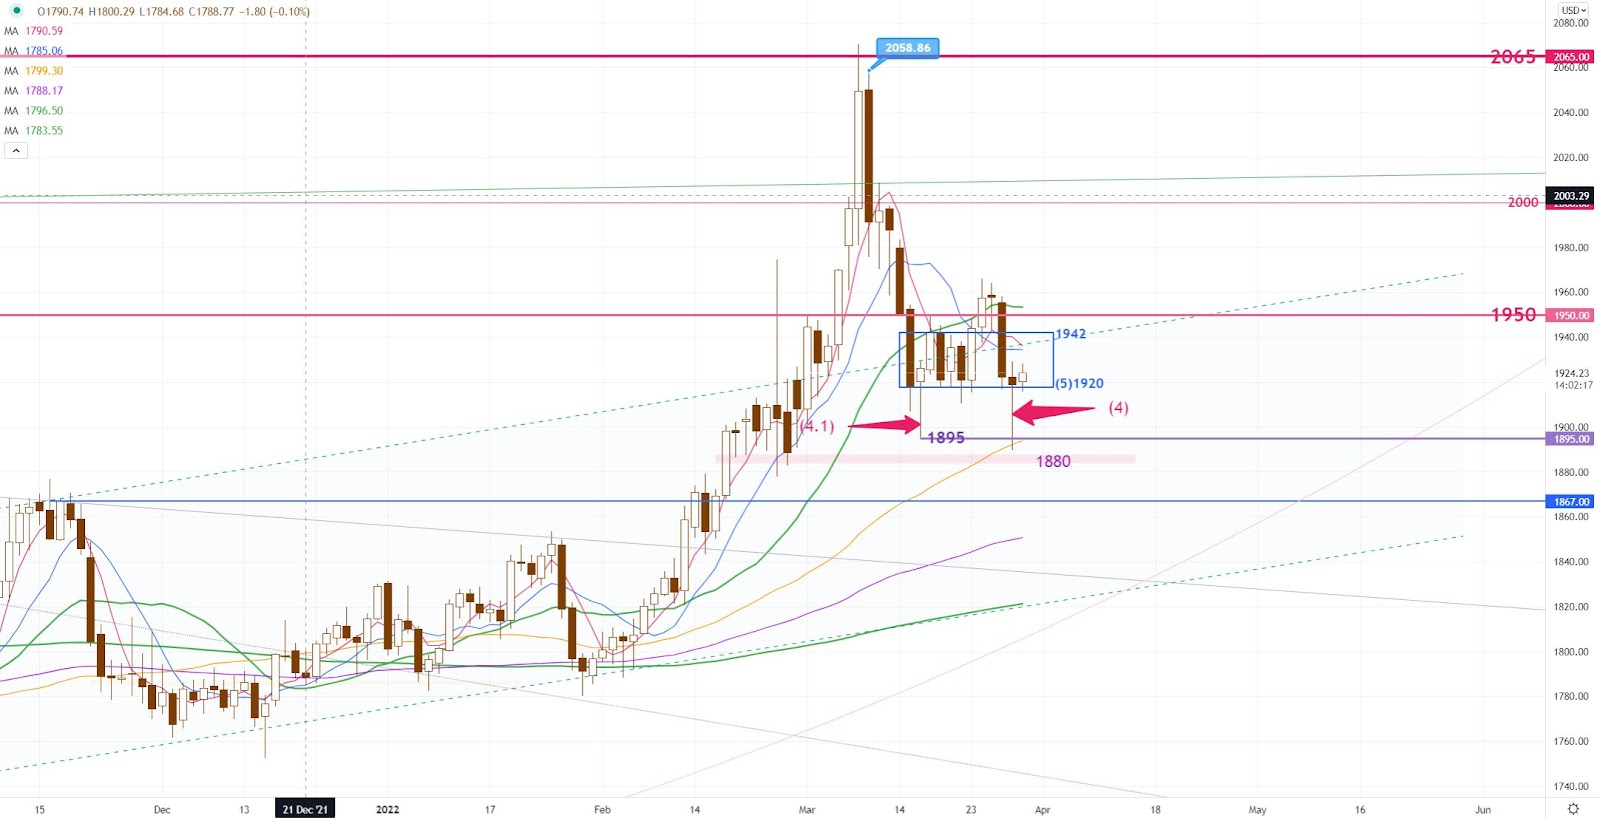
Gold successfully defended its closing price around the 1920(5) level yesterday, and the rally before the day’s end has created a bottoming out signal(4) in the daily chart, similar to the one(4.1) that occurred on the Fed. Meeting day. Technically, the price should be able to reach the top of the range near 1940-42 in S-T again.


S-T Resistances:

1950

1940-41

1930


Market price: 1924

S-T Supports:

1920

1915

1910-08


Risk Disclosure: Gold Bullion/Silver (“Bullion”) trading carries a high degree of risk, and may not be suitable for all investors. The high degree of leverage can work against you as well as for you. This article is for reference only and is not a solicitation or advice to trade any currencies and investment products . Before deciding to trade Bullion you should carefully consider your investment objectives, level of experience, and risk appetite. The possibility exists that you could sustain a loss of some or all of your initial investment or even more in extreme circumstances (such as Gapping underlying markets) and therefore, you should not invest money that you cannot afford to lose. You should be aware of all the risks associated with trading Bullion, and seek advice from an independent financial advisor if you require. Client should not make investment decision solely based on the point of view and information on this article. 


Tag:
最新 技術分析
技術分析

黃金走勢 21/10 – 突破區間阻力 上升動力持續

金價上週走勢出乎我們意料,在相對沒有重要...
Read More
技術分析

黃金走勢 14/10 – 本週區間操作

國際金價上週先跌後反彈: 上週市場將焦點...
Read More
技術分析

黃金走勢 07/10 – 11月減息半厘機會率歸零 短線難再破頂!

金價升勢在上週放慢,整體價格在高位窄幅震...
Read More
技術分析

黃金走勢 30/9 – 升勢放緩 短線把握間操作

承接前週尾段的上升趨勢,金價上週續創新高...
Read More
技術分析

黃金走勢 23/09 – 未有見頂訊號 繼續順勢操作

自從金價2週前突破之前的2480-253...
Read More
技術分析

黃金走勢 09/09 – 繼續高位震蕩 (III)

國際金價上週繼續在高位橫行,未有突破。過...
Read More
技術分析

黃金走勢 02/09 – 繼續高位震蕩(II)

國際金價上週在高位震蕩,整體合付預期。一...
Read More
技術分析

黃金走勢 26/8 – 繼續高位震盪

國際金價上周初承接了前週五突破2480的...
Read More
技術分析

黃金走勢 20/8 – 突破2480後 趨勢繼續往上

現貨金價上週先跌後突破。週初早段貼近高位...
Read More
技術分析

黃金走勢 12/08

承接前週五非農數據公佈後的下跌趨勢,上週...
Read More
技術分析

黃金走勢 05/08 – 減息預期增 但金價已缺乏上升動力!

國際金價上週走勢整體向上,但在週五美盤非...
Read More
技術分析

黃金走勢 22/07 – 未能站穩2450之上 金價進入短線調整週期

國際金價上週先升後回落。早段週二受較弱的...
Read More
技術分析

黃金走勢 15/07 – 本週醞釀向上突破?

國際金價上週受美國放緩的通脹數據刺激,突...
Read More
技術分析

黃金走勢 17/06 – 調整趨勢放緩 本週把握區間操作

國際金價自月初美就業數據公佈單日大跌90...
Read More
技術分析

黃金走勢 10/06 – 本週消息主導 但繼續逢高沽空

國際金價上週先升後跌,在週五做出近月最大...
Read More
技術分析

黃金走勢 03/06 – 調整繼續 本週將下試2300以下

國際金價自前週失守2380支持後,上週進...
Read More
技術分析

黃金走勢 27/05 – 失守2380 黃金處於弱勢

國際金價上週初突破前高2431,在週一亞...
Read More
技術分析

黃金走勢 20/05 – 買盤開始主導 蘊醞第二升浪

國際金價自本月初一連串重要美國數據做差後...
Read More
技術分析

黃金走勢 13/05 – 反彈接近尾聲 等待週三美核心通脹

過去一週美國未有重要經濟數據公佈,導至黃...
Read More
技術分析

黃金走勢 06/05 – 穩守2280支持 短線反彈開始

國際金價上週尾段3次下試2280支持,最...
Read More
最新 圖表形態
Daily chart TKO

Dow

Daily chart TKO

EURUSD 1d

Daily chart TKO

CLc1 Daily

Daily chart TKO

BTCUSD Daily

1 hour chart TKO

XAUUSD 1h

Daily chart TKO

CLc1 Daily

1 hour chart TKO

XAUUSD 1h

Daily chart TKO

EURJPY 1d

1 hour chart TKO

XAUUSD 1h

1 hour chart TKO

XAUUSD 1h

1 hour chart TKO

USDCAD 1h

1 hour chart TKO

GBPUSD 1h

1 hour chart TKO

XAGUSD 1h

Daily chart TKO

EURUSD Daily

Daily chart TKO

GBPUSD Daily

1 hour chart TKO

XAUUSD 1h

1 hour chart TKO

DXY 1h

1 hour chart TKO

GBPJPY 1h

1 hour chart TKO

XAUUSD 1h

1 hour chart TKO

EURUSD 1h

尚勢財經 | 1uptick Analytics @

提高盈利機會 放輕您的交易壓力

風險提示​

*投資涉及風險。 閣下可自行决定利用本網站的資料、策略及交易訊號作學術及參考用途。1uptick 不能亦不會保證任何在本網站/應用程式中發表,現在或未來的買入或賣出評論和訊息會否帶來贏利。過往之表現不一定反映未來之表現。1uptick不可能作出該保證及用戶不應該作出該假設。讀者在執行交易前應諮詢獨立專業意見。1uptick不會游說任何訂戶或訪客執行任何交易,閣下須為所有執行的交易負責。

© 2022-24 – 1uptick Analytics 版權所有,不得轉載。


風險提示​

*投資涉及風險。 閣下可自行决定利用本網站的資料、策略及交易訊號作學術及參考用途。1uptick 不能亦不會保證任何在本網站/應用程式中發表,現在或未來的買入或賣出評論和訊息會否帶來贏利。過往之表現不一定反映未來之表現。1uptick不可能作出該保證及用戶不應該作出該假設。讀者在執行交易前應諮詢獨立專業意見。1uptick不會游說任何訂戶或訪客執行任何交易,閣下須為所有執行的交易負責。

© 1uptick Analytics 版權所有,不得轉載。

首頁
市況分析
財經日曆
交易工具
交易訊號