
GBPUSD ready for a rebound?
Price Movement The daily candlestick chart displays a notable downtrend in price movement. After reaching a peak near 1.34345, the asset experienced a significant retracement, characterized by a series of lower highs and lower lows. The decline was further emphasized as the price fell below the Fibonacci levels of 0.786 and 0.618, signaling potential bearish […]

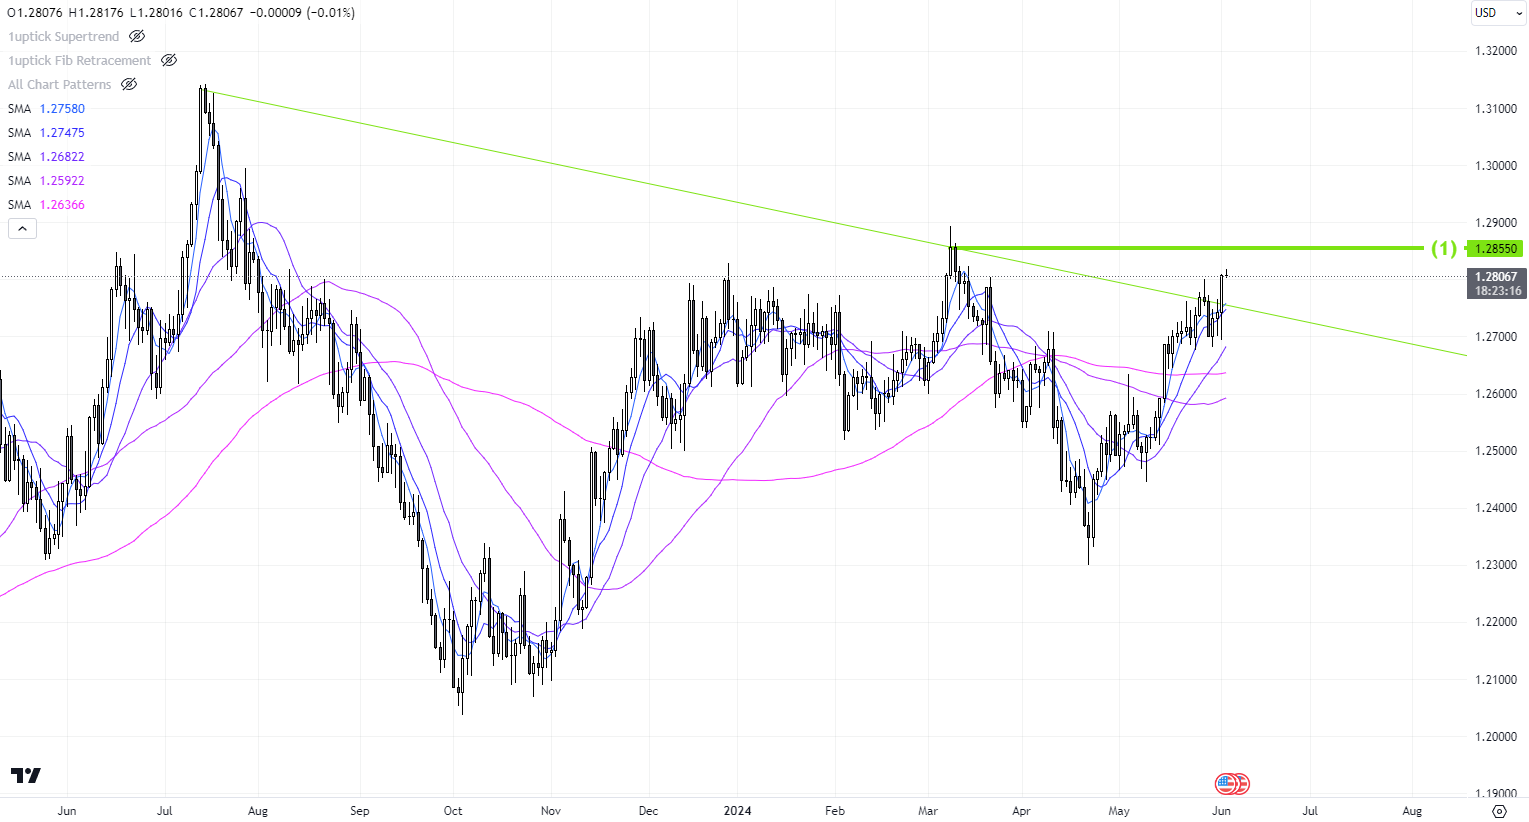
GBPUSD 1d
⚠️ 通知 日線圖 技術指標 / 形態 1 阻力線 1.2855 2 上升支持 *所有技術觸發將即時發送到 Telegram 頻道

GBPUSD 1d
⚠️ 通知 日線圖 技術指標 / 形態 1 上升支持線 *所有技術觸發將即時發送到 Telegram 頻道

USDCAD 1h
???? Alerts Technical Indicator / Pattern 1. S-T upper resistance 2. S-T lower support 3. Head & shoulder neckline

GBPUSD 1h
???? Alerts Technical Indicator / Pattern 1. S-T upper resistance 2. S-T lower support 3. M-T upper resistance 4. M-T lower resistance
GBPUSD Daily
???? Alerts Technical Indicator / Pattern 1. Resistance line @ 1.2855