GBPUSD ready for a rebound?
2025-01-14 @ 12:46

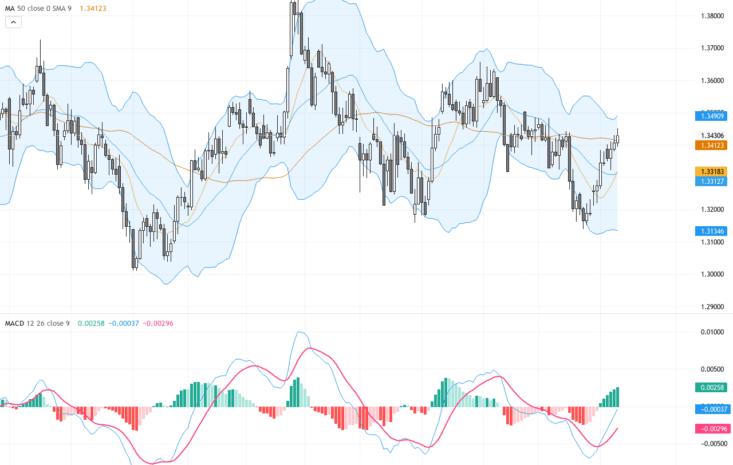
Price Movement
The daily candlestick chart displays a notable downtrend in price movement. After reaching a peak near 1.34345, the asset experienced a significant retracement, characterized by a series of lower highs and lower lows. The decline was further emphasized as the price fell below the Fibonacci levels of 0.786 and 0.618, signaling potential bearish strength. The Simple Moving Averages (SMA) also reflect this downtrend, with shorter-term moving averages crossing below the longer-term averages, confirming bearish momentum. The price recently approached the support zone near 1.21079, with candlestick patterns indicating attempts to secure footing in this region. Overall, the asset’s current trajectory suggests sustained downward pressure, influenced by various technical indicators that highlight bearish market sentiments.
Technical Analysis
| Technical Pattern/Indicator | Analysis and Trend |
|---|---|
| Fibonacci Retracement Levels | Price broke below key retracement levels of 0.786 (1.31479) and 0.618 (1.29226), indicating bearish continuation. |
| Simple Moving Averages (SMA) | Crossing of short-term SMAs below long-term SMAs suggests strengthening downtrend. |
| Trendline | The breach of an upward trendline confirms reversal and continuing bearish sentiment. |
| Support Zone | Approaching the support around 1.21079, indicating a potential halt or rebound. |
Outlook
The current outlook for the asset appears to be bearish, with strong downward momentum observed on the chart. The break beneath key Fibonacci levels and the downward crossover of SMAs reinforce the prevailing downtrend. However, the proximity to a critical support zone near 1.21079 could provide temporary respite or trigger a corrective bounce. Traders should monitor price action closely around this level, looking for potential reversal signals or confirmations of further declines. Short-term opportunities might arise if the support level holds, while continued vigilance is advised amid volatile conditions.
Support and Resistance
| Support Levels | Resistance Levels |
|---|---|
| 1.21079 | 1.23461 |
| 1.20942 | 1.24998 |
| 1.20663 | 1.27645 |