
The rapid retraction from the new high suggests the gold price has entered a short-term correction period.
Gold reached a new all-time high of 2431 last Friday after the US market opened, but the price quickly retreated. It lost key support of 2400 and 2380, falling back to the bottom support of Thursday near 2330, ending the weekly at 2343 with a slight increase of 13 dollars. The market had been anticipating retaliatory actions from Iran following the attack on the Iranian embassy in Syria, creating a relatively tense environment that led to the climb in gold prices in the past two weeks. There was noticeable profit-taking in the market, coincidentally 24 hours before Iran’s retaliation. After the long-awaited Iran’s retaliatory action, the risk sentiment decreased abruptly; although gold opened with a gap of around 10 dollars on Monday’s Asian session, the movement remained relatively calm. The S-T upward trend began to slow down after the rapid retracement on Friday. At this point, we can expect a range-bound consolidation to begin to form this week.
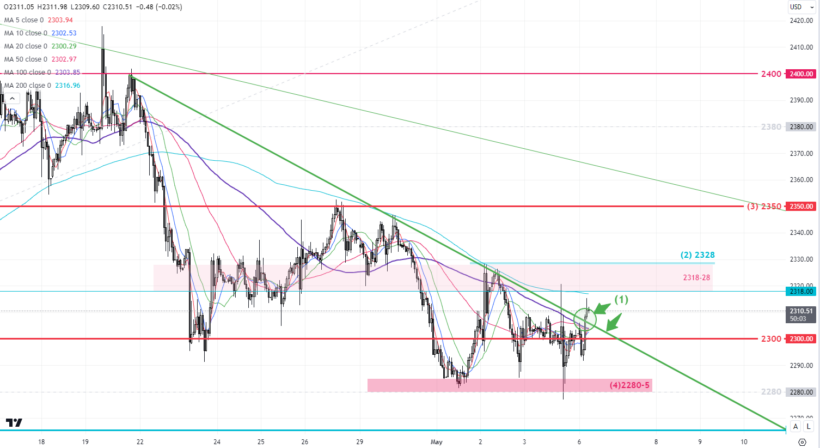
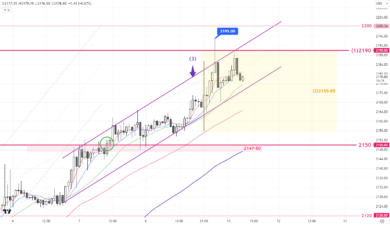
1-Hr Chart – The gold price has been steadily climbing along the upward trend channel(1) since it broke through the 2300 resistance at the night of the non-farm payroll at the beginning of the month. The price is still sitting within the upward channel(1). However, S-T resistance is expected around 2375-2380 after the market experienced significant volatility on Friday. For now, the trading range for this week can be set at around 2318-2380(2).
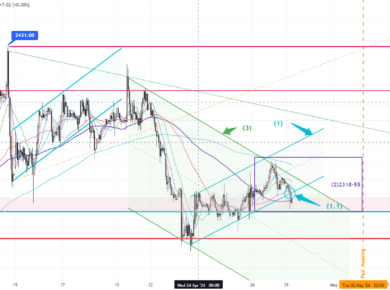
Daily Chart – After the reversal in gold price last Friday, there is a clear indication of a potential peak (3). As long as the closing price in the next two days remains below 2373 (4), a more noticeable correction is likely to occur. The initial target for this correction can be set around the 20-day moving average (5).
Monthly Chart – It is important to note that the gold price is approaching the upper boundaries of the long-term upward channels (6) and (7). For the upward trend to continue, the gold price must break through the resistance line at the top of the channels. Otherwise, a correction in the overall trend may be needed.
S-T ressitance 3
2380
S-T ressitance 2
2370-72
S-T ressitance 1
2365
Market price
2359
S-T support 1
2350-52
S-T support 2
2345
S-T support 3
2338-40
P. To
Risk Disclosure: Gold Bullion/Silver (“Bullion”) trading carries a high degree of risk, and may not be suitable for all investors. The high degree of leverage can work against you as well as for you. This article is for reference only and is not a solicitation or advice to trade any currencies and investment products . Before deciding to trade Bullion you should carefully consider your investment objectives, level of experience, and risk appetite. The possibility exists that you could sustain a loss of some or all of your initial investment or even more in extreme circumstances (such as Gapping underlying markets) and therefore, you should not invest money that you cannot afford to lose. You should be aware of all the risks associated with trading Bullion, and seek advice from an independent financial advisor if you require. Client should not make investment decision solely based on the point of view and information on this article.
Browsing Category
technical
226 posts
Gold Trend 25/03
Following the Fed meeting, gold reached a new all-time high of 2222 last week. However, it failed to stay above 2200 and retraced quickly below the previous high of 2195 within 24 hours. This Friday is a US holiday, but the inflation data(PCE price index) will still be released. Make sure you pay close attention to market volatility at the late Friday session and the early Monday Asian session, and exercise caution in managing risks.
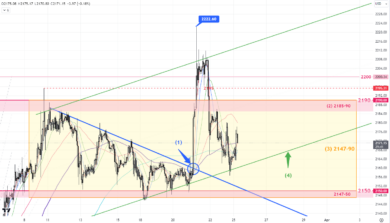
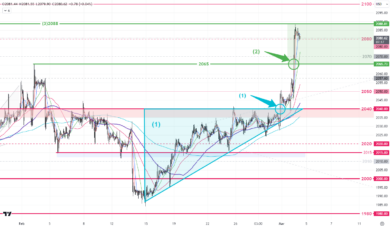
1-hr chart – The price broke through the S-T resistance(1) last week and reached our target range of 2185-2190 (2). Although it subsequently reached a new high, the price is now falling back to 2147-90(3). The resistance zone of 2186-90(2) is still valid. Take advantage of the rebound driven by the newly formed upward channel(4) at the beginning of this week, and expect the price to be bound within 2147-90 (3) in S-T until another news breaks out.
Daily chart – After the quick pull-back after the Fed. Meeting last week, a reserval signal(5) has appeared. Unless the gold price can close above 2190 on the daily chart, an S-T consolidation period is likely to occur in the next two weeks. Again, 2147 is the key support level, once its clear the next support will be at the 20-day MA.
S-T ressitance 3
2190
S-T ressitance 2
2185
S-T ressitance 1
2180
Market price
2175
S-T support 1
2168
S-T support 2
2165
S-T support 3
2155
P. To
Risk Disclosure: Gold Bullion/Silver (“Bullion”) trading carries a high degree of risk, and may not be suitable for all investors. The high degree of leverage can work against you as well as for you. This article is for reference only and is not a solicitation or advice to trade any currencies and investment products . Before deciding to trade Bullion you should carefully consider your investment objectives, level of experience, and risk appetite. The possibility exists that you could sustain a loss of some or all of your initial investment or even more in extreme circumstances (such as Gapping underlying markets) and therefore, you should not invest money that you cannot afford to lose. You should be aware of all the risks associated with trading Bullion, and seek advice from an independent financial advisor if you require. Client should not make investment decision solely based on the point of view and information on this article.
Gold Trend 18/03
After reaching a new high of 2195, the gold price stayed sideways between 2155-85(1) last week. This week’s only major event will be the Fed meeting. Following the slight rebound in US core CPI data last week, expect the post-Fed meeting announcement to lean towards a hawkish stance, which could have a bearish impact on the gold price.
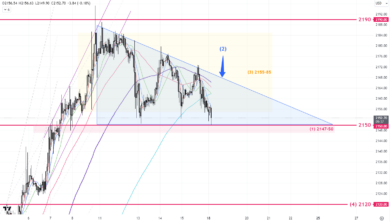
1-hr Chart – The gold price is still bounded within the range of 2155-85 (3), and it is currently trading under the S-T resistance line (2) that has been in place for the past few trading days. If the critical support level of 2147-2150(1) is breached, the next downside target can be set around 2120(4).
Daily Chart – Structurally, there hasn’t been any significant change on the daily chart, with the upward channel(5) remaining valid. The gold price is still standing above the previous high of 2147(7). If the buying support from the previous high of 2147(7) is cleared, a major correction toward 2120 should occur and pay attention to the next support at the 20-day MA(6).
S-T ressitance 3
2168
S-T ressitance 2
2160
S-T ressitance 1
2155
Market price
2152
S-T support 1
2147-50
S-T support 2
2140
S-T support 3
2130
P. To
Risk Disclosure: Gold Bullion/Silver (“Bullion”) trading carries a high degree of risk, and may not be suitable for all investors. The high degree of leverage can work against you as well as for you. This article is for reference only and is not a solicitation or advice to trade any currencies and investment products . Before deciding to trade Bullion you should carefully consider your investment objectives, level of experience, and risk appetite. The possibility exists that you could sustain a loss of some or all of your initial investment or even more in extreme circumstances (such as Gapping underlying markets) and therefore, you should not invest money that you cannot afford to lose. You should be aware of all the risks associated with trading Bullion, and seek advice from an independent financial advisor if you require. Client should not make investment decision solely based on the point of view and information on this article.
Gold Trend 11/03 – Reversal signals yet to appear
The gold price was unstoppable last week. It broke clear the December high of 2088 and surpassed the historical high of 2147. On Friday, even with better-than-expected US non-farm payroll data, it continued to rise before the market closed, reaching a new all-time high of 2195. This week, the US will release core CPI and retail sales data on Tuesday and Thursday, if inflation slows down and the data disappoints, we can expect the gold price to continue its upward movement.
1-hr Chart – The gold price was rejected by 2190(1) again during the Asian session today. Since breaking through the resistance at 2147-2150 last week, an S-T upward channel(3) has formed in the past 48 hours. If the gold price breaks below the upward channel(3) after Tuesday’s data, the trading range can be set between 2155-85(2).
Daily Chart – After breaking through the December high of 2088 (4) last week, gold officially began its uptrend. The upside target 2190, estimated based on the previous consolidation range of 1:1 (4.1), has been reached. As the gold price is approaching the upper resistance of the M-T upward channel(5), the gold price has pullback(6) before the market closed on Friday. Keep an eye out; it would be the first signal of another surge if the gold price closes above 2178 on the daily chart in the next 2 days. Otherwise, a retreatment toward 2147-50 will begin.
P. To
Gold Trend 04/03 – The next bull after US stocks & crypto ?
A series of US data was released last week. The durable goods orders and 4Q GDP announced early on Tue’s and Wed’s were both below market expectations. However, the price of gold remained in a narrow range. It wasn’t until Thur’s release of the core PCE price index that the gold price finally broke clear the resistance zone of 2035-40. On Fri, a new round of buying was triggered after a weaker-than-expected manufacturing PMI pushed the price to the recent high of 2088.
The latest CME FedWatch indicates that the probability of a rate cut in May is now around 27%, while the likelihood for June has risen to around 70%. The rate cut news/rumours will push the gold price higher, however, the 2088 resistance still needs to be clear. Once the price passes 2088, the 1st target can be set at around 2045. A strict stop-loss order should be in place if you choose to short-selling above 2080.
1-Hour Chart – Gold has triggered a round of buying after escaping the triangle pattern (1) last Thur. The upward momentum has accelerated on Fri’s US session, passing the early Feb high of 2065(2) and reaching the Dec high of 2088(3). The buying momentum failed to carry on at the early Asian session back from the weekend. A high-volume market condition is needed for gold to clear the 2088 resistance, pay attention to Tue’s non-manufacturing PMI, Wed.’s Powell speech. Consider the trading range of 2065-88(4) for now.
Daily Chart – Gold escapes downward channel (4) last week, and the M-T trend shifted from a downtrend to a sideways consolidation, where the range has expanded from 1985-2065(5) to 1985-2088(5.1). The price needs to break above 2088 in terms of structure to initiate a new round of buying orders.
S-T ressitance 3
2100
S-T ressitance 2
2095
S-T ressitance 1
2085-88
Market price
2080
S-T support 1
2070
S-T support 2
2065
S-T support 3
2018-20
P. To
Risk Disclosure: Gold Bullion/Silver (“Bullion”) trading carries a high degree of risk, and may not be suitable for all investors. The high degree of leverage can work against you as well as for you. This article is for reference only and is not a solicitation or advice to trade any currencies and investment products . Before deciding to trade Bullion you should carefully consider your investment objectives, level of experience, and risk appetite. The possibility exists that you could sustain a loss of some or all of your initial investment or even more in extreme circumstances (such as Gapping underlying markets) and therefore, you should not invest money that you cannot afford to lose. You should be aware of all the risks associated with trading Bullion, and seek advice from an independent financial advisor if you require. Client should not make investment decision solely based on the point of view and information on this article.

Gold Trend 26/02
The expectation of the Fed’s interest rate cuts continues to support the fundamentals of the gold price. However, since the market kept delaying the rate cuts schedule without significant economic news, gold was traded sideways above 2020 last week. More news is expected this week, with the US announcing durable goods orders, 4Q GDP, PCE inflation, and manufacturing PMI. Regardless of whether the data is better or worse than expectations, the daily price fluctuations of gold should be widened toward around the $20 range. Considering the current market sentiment, unless these data significantly exceed expectations, it will not be easy for gold to break free from the current sideway sentiment. Therefore, we can continue to take advantage of the 2015-2040 range this week.
1hr chart – Last week, the daily price fluctuations of gold expanded from a narrow range at the beginning of the week to a broader USD 25 range (1) near the week’s end. The market dynamics should be similar to last Fri. on data release days this week. The resistance zone around 2035-2040 is still valid, and the day trading strategy should continue to be based on the range of 2015-40.
Daily Chart – After the rejection of 2041 on Friday, the rebounding cycle from the bottom of the downward channel(3) is getting close to an end. Short-selling near 2040 in the next 1-2 days will be ideal if the gold price is to touch 2040 again. Once the price falls below the 20-day ma(4) near the end of this week, the adjustment target can be set at 2010 or even lower for next week.
S-T ressitance 3
2045
S-T ressitance 2
2040
S-T ressitance 1
2035
Market price
2031
S-T support 1
2030
S-T support 2
2025
S-T support 3
2018-20
P. To
Risk Disclosure: Gold Bullion/Silver (“Bullion”) trading carries a high degree of risk, and may not be suitable for all investors. The high degree of leverage can work against you as well as for you. This article is for reference only and is not a solicitation or advice to trade any currencies and investment products . Before deciding to trade Bullion you should carefully consider your investment objectives, level of experience, and risk appetite. The possibility exists that you could sustain a loss of some or all of your initial investment or even more in extreme circumstances (such as Gapping underlying markets) and therefore, you should not invest money that you cannot afford to lose. You should be aware of all the risks associated with trading Bullion, and seek advice from an independent financial advisor if you require. Client should not make investment decision solely based on the point of view and information on this article.

Gold Trend 19/02
Gold price rallied from a 3-month low last week. The US core inflation rate came in higher than expected, causing the gold price to break below the critical support level of 2000 and drop close to 1980. However, the release of the disappointing US retail sales data pushed the gold price back above 2000 (1) on Thu., ending the week near 2013. The main event on the economic calendar this week will be the release of the US Fed. Meeting minutes on Wed. Not expecting any surprising content, the dominant factors will remain to be “observing the data,” “waiting for more evidence,” and “the timing of rate cuts being slower than market expectations,” which are mostly bearish for gold, pulling the gold price down in S-T.
1-hour chart – An S-T upward channel(3) has formed in the past 24 hours. At the Asian session today, the gold price has broken through the previously mentioned downward resistance(2) and resistance zone (2.1). There are signs of accelerating buying pressure, and the price has already moved above the channel(3). The S-T target can be set at last Tue’s high near 2028(4), where the next upside target is at the resistance zone (5). With the US holiday on Monday, the market volume may be reduced. Tentatively, the trading range for this week can be set between 2000-40.
Daily Chart – Last week’s downward channel (7) is still valid, and some S-T resistance from the 20-day MA(6) is expected. The overall structure has transformed from a sideways consolidation (8) to a downward correction (7) after the release of US inflation data last week.
S-T ressitance 3
2030
S-T ressitance 2
2023
S-T ressitance 1
2020
Market price
2018
S-T support 1
2015
S-T support 2
2010
S-T support 3
2002
P. To
Risk Disclosure: Gold Bullion/Silver (“Bullion”) trading carries a high degree of risk, and may not be suitable for all investors. The high degree of leverage can work against you as well as for you. This article is for reference only and is not a solicitation or advice to trade any currencies and investment products . Before deciding to trade Bullion you should carefully consider your investment objectives, level of experience, and risk appetite. The possibility exists that you could sustain a loss of some or all of your initial investment or even more in extreme circumstances (such as Gapping underlying markets) and therefore, you should not invest money that you cannot afford to lose. You should be aware of all the risks associated with trading Bullion, and seek advice from an independent financial advisor if you require. Client should not make investment decision solely based on the point of view and information on this article.

Gold trend 12/02
Keep an eye on the gold price for a downward adjustment after the US CPI this week.
The gold market was relatively calm last week; the trading volume of COMEX gold futures noticeably declined, dropping from an average daily volume of over 200,000 contracts in Jan. to only 140,000 since the beginning of the week. Adding that no significant economic data was being released, the price mainly bounced within the range of 2020-2040(1). As expected, we hope everyone took advantage of the situation✊. The trend hasn’t changed much after a week of sideways movement. The key focus this week, without a doubt, is the US CPI data on Tuesday. I expect the data to push the gold price higher towards the resistance zone around 2035-2040(3). Whether it can jump across 2050 will very much depend on whether the data release brings any surprises. On the other hand, according to CME’s FedWatch, the probability of a rate cut in March has decreased to around 60%, so the chances of gold reaching new highs in the S-T are slim. The S-T price will likely continue oscillating within the sideway range… but still be mindful of a potential deeper consolidating cycle.
1-hour chart – We can continue utilizing the 2020-40(1) range for S-T. Keep an eye on the downward resistance line formed last week(2). If the price breaks above this resistance line within the next 48 hours, it will trigger a round of buying orders, and the price may reach once again the 2040 resistance zone (3). The key support level below is at 2015.
Daily chart – Although the upward trendline (4) is still valid, the probability of a rate cut in May is declining. Unless US inflation significantly slows down in the next two weeks, it will be difficult for the gold price to maintain its current upward movement above the trendline(4). If the gold price falls below the support line (4) in this week, it will trigger a round of selling, and the price is likely to test the bottom of the 2002-2065 range (5) again.
S-T ressitance 3
2040
S-T ressitance 2
2035
S-T ressitance 1
2030
Market price
2024
S-T support 1
2020
S-T support 2
2015
S-T support 3
2008-10
P. To
Risk Disclosure: Gold Bullion/Silver (“Bullion”) trading carries a high degree of risk, and may not be suitable for all investors. The high degree of leverage can work against you as well as for you. This article is for reference only and is not a solicitation or advice to trade any currencies and investment products . Before deciding to trade Bullion you should carefully consider your investment objectives, level of experience, and risk appetite. The possibility exists that you could sustain a loss of some or all of your initial investment or even more in extreme circumstances (such as Gapping underlying markets) and therefore, you should not invest money that you cannot afford to lose. You should be aware of all the risks associated with trading Bullion, and seek advice from an independent financial advisor if you require. Client should not make investment decision solely based on the point of view and information on this article.

Gold trend 05/02
The gold price was under the influence of two major events last week, the FOMC meeting and the non-farm payrolls report, which resulted in significant daily fluctuations; however, the closing price for the entire week resumed its position below 2040, without any clear structural breakthrough. The post-FOMC statement kept the probability of a rate cut in March to a mere 15% (according to CME’s FedWatch Tools). Adding the non-farm payroll data on Fri., once again exceeded the market’s expectation for the second consecutive month and pulled the gold price back below the 2040 range before the week ended.
Although the range trading strategy we’ve been suggesting in recent weeks aligned perfectly with the overall trend in the gold market, and the resistance and support levels performed as expected, last week’s market involved too many uncertain factors. I would say the trading difficulty reached the “Black Diamond” level, with rapid and wide swings in the price movements.
1-Hour Chart – The difficulty of trading should ease down this week as no major economic data is being released, and with the approaching of the CNY holiday. The gold market is expected to resume the range-bound pattern & vibe we saw two weeks ago. After the gold price drops below 2040, we can continue to take advantage of the 2020-40(2)range. The S-T resistance zone remains in 2035-2040(1), nothing new 😂😂😂. However, I believe that in the next 48 hours, we should see the price reaching the bottom of the S-T near 2020.
Daily Chart – The range structure we’ve been highlighting in the past few weeks, between 2002-65(3), is still valid. At the moment, the price is trapped within a consolidating triangle pattern(5). For the price to return to the bottom of the range, it needs to break out of the triangle formation. In S-T, keep an eye on the 20-day moving average as a support level.
S-T ressitance 3
2048
S-T ressitance 2
2040
S-T ressitance 1
2030
Market price
2034
S-T support 1
2030
S-T support 2
2027
S-T support 3
2020
P. To
Risk Disclosure: Gold Bullion/Silver (“Bullion”) trading carries a high degree of risk, and may not be suitable for all investors. The high degree of leverage can work against you as well as for you. This article is for reference only and is not a solicitation or advice to trade any currencies and investment products . Before deciding to trade Bullion you should carefully consider your investment objectives, level of experience, and risk appetite. The possibility exists that you could sustain a loss of some or all of your initial investment or even more in extreme circumstances (such as Gapping underlying markets) and therefore, you should not invest money that you cannot afford to lose. You should be aware of all the risks associated with trading Bullion, and seek advice from an independent financial advisor if you require. Client should not make investment decision solely based on the point of view and information on this article.

Gold trend 29/01
The gold price was moving within a narrow range last week. The price was bounded by 2020-40 until Wednesday’s US better-than-expected GDP data; it cleared the 2020(2) support and dropped to as low as 2010.
There are two major economic events to pay attention to this week. First, we have the Fed. Meeting on Wednesday. There is a 95% chance that the interest rates will remain unchanged (according to CME’s FedWatch)in this week’s meeting. And the statement they release after the meeting…I’m expecting the Fed. is unlikely to make any sudden moves in the next few months, considering the Fed’s habits of slow acting at the beginning of this rate hike cycle and most of the economic figures haven’t shown any dramatic improvement recently. Unless Powell makes some unexpected comments, the chances of a rate cut in March… or even in May, might stay around 50-60% with no major changes afterward. On the other hand, the US employment data at the end of this week is also expected to be in line with expectations, with possibly downward pressure on the price of gold. The price of gold hasn’t shown any signs of a breakout, so it’s still a good idea to continue trading within the established range.
1-Hour Chart – The price of gold dropped below the 2020(2) and rebounded from the lows near 2010. It has failed to reach the previous low point of 2001(5), indicating that buying positions below 2010 have become stronger. Today, in the Asian trading session, the spot gold price has already returned above the 2020 mark. Over the past 48 hours, an S-T upward channel(4) has formed, suggesting the possibility of revisiting the resistance zone of 2035-40(1), likely before the Fed. Meeting.
Daily Chart – Market uncertainty is expected to increase mid to late this week, so it’s crucial to be cautious about potential breakouts in technical patterns. The resistance zone around 2030-40(9) is still cursing the market. In the next two trading days, watch the 20-day MA(8). The upward support line(6) is still holding, and if a breakout occurs, the bottom of the range near 2001 could become the next support level.
S-T ressitance 3
2040
S-T ressitance 2
2035
S-T ressitance 1
2030
Market price
2025
S-T support 1
2020-2
S-T support 2
2015
S-T support 3
2010
P. To
Risk Disclosure: Gold Bullion/Silver (“Bullion”) trading carries a high degree of risk, and may not be suitable for all investors. The high degree of leverage can work against you as well as for you. This article is for reference only and is not a solicitation or advice to trade any currencies and investment products . Before deciding to trade Bullion you should carefully consider your investment objectives, level of experience, and risk appetite. The possibility exists that you could sustain a loss of some or all of your initial investment or even more in extreme circumstances (such as Gapping underlying markets) and therefore, you should not invest money that you cannot afford to lose. You should be aware of all the risks associated with trading Bullion, and seek advice from an independent financial advisor if you require. Client should not make investment decision solely based on the point of view and information on this article.