2023-12-27 @ 11:49
Gold cleared the key resistance level of 2050(1) last Friday, triggering a new round of buying and retesting the high @ 2070. However, the price quickly retreated before the market closed. The session ended at 2052, above the key level of 2050 before the holiday weekend. 1-hour chart – After breaking through the level of […]
2023-12-27 @ 10:49
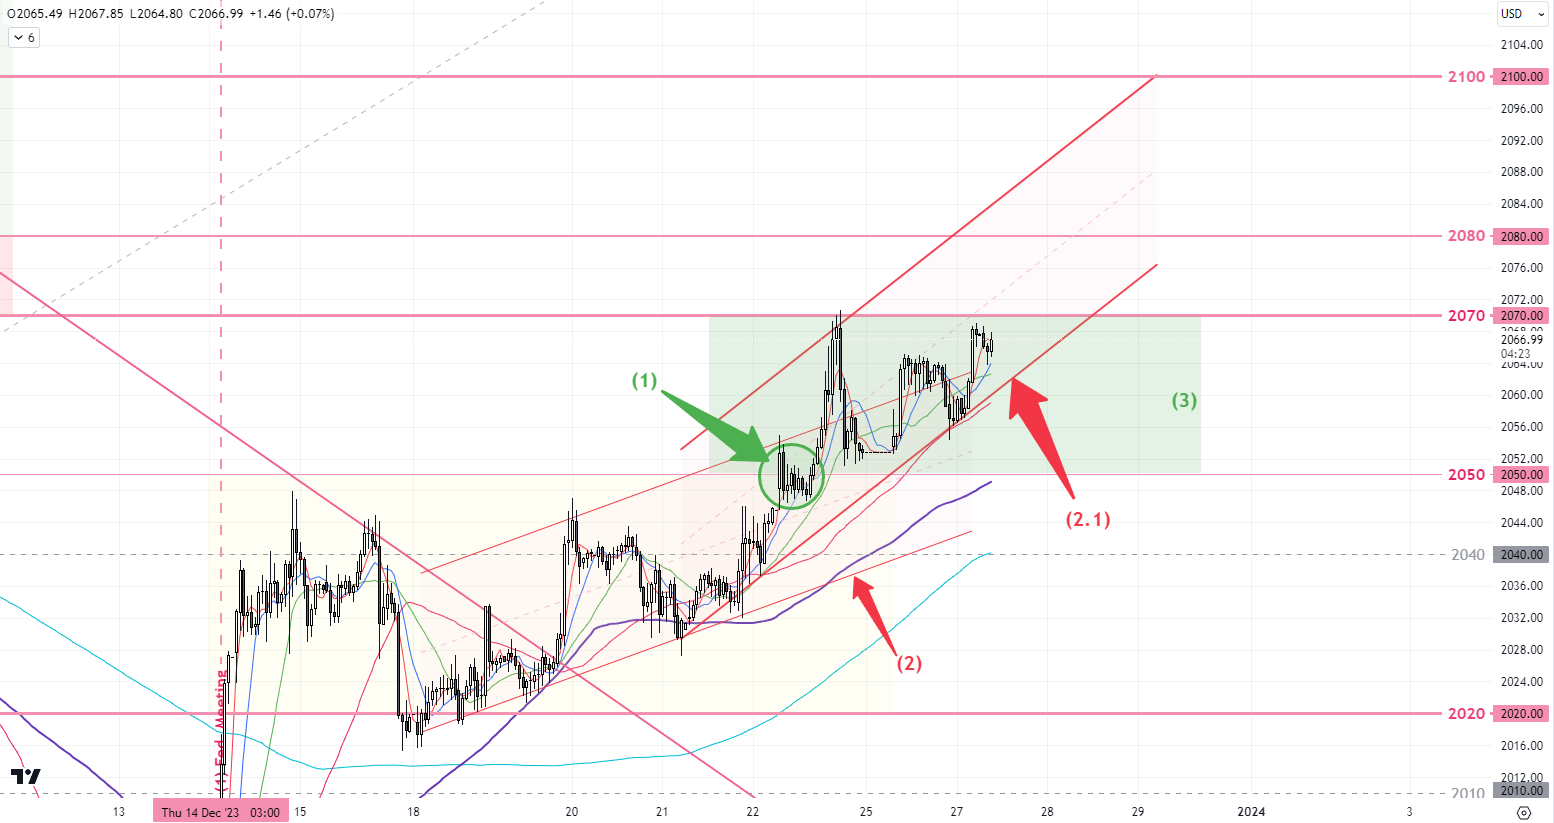
Gold cleared the key resistance level of 2050(1) last Friday, triggering a new round of buying and retesting the high @ 2070. However, the price quickly retreated before the market closed. The session ended at 2052, above the key level of 2050 before the holiday weekend.
1-hour chart – After breaking through the level of 2050(1) last week, the upward trend in gold has accelerated, transitioning from a relatively stable upward channel(2) to a faster pace in (2.1). In order for gold to sustain the current upward trend, the price must surpass the key 2070 resistance in the next 24 hours; otherwise, the price may escape from the upward(2.1) trend and enter a sideways pattern between 2050-70(3). Let’s patiently wait for signals to appear, as capturing the trend should not be too difficult.
Daily chart – The selling pressure(4) built up by the rejection of 2070 before the holiday has been absorbed by yesterday’s buying orders, as indicated by the high closing prices (4.1) above 2060. A signal of a market top has yet to appear, so the upward movement should continue to dominate the daily chart. However, expect strong resistance at 2070-72, it’s better not to be too aggressive until it clears this resistance.
                   S-T ressitance 3

                                            2080

                   S-T ressitance 2

                                            2075

                   S-T ressitance 1

                                            2070-72

                                                Market price

                                                2064

                   S-T support 1

                                            2060

                   S-T support 2

                                            2055

                   S-T support 3

                                            2050
P. To
Risk Disclosure: Gold Bullion/Silver (“Bullion”) trading carries a high degree of risk, and may not be suitable for all investors. The high degree of leverage can work against you as well as for you. This article is for reference only and is not a solicitation or advice to trade any currencies and investment products . Before deciding to trade Bullion you should carefully consider your investment objectives, level of experience, and risk appetite. The possibility exists that you could sustain a loss of some or all of your initial investment or even more in extreme circumstances (such as Gapping underlying markets) and therefore, you should not invest money that you cannot afford to lose. You should be aware of all the risks associated with trading Bullion, and seek advice from an independent financial advisor if you require. Client should not make investment decision solely based on the point of view and information on this article.
2023-12-18 @ 12:25
After the Fed. Meeting last week, gold climbed above 2000, while the market refocused on an early rate cut next year. Powell’s dovish comments further tuned the market’s sentiments; the latest CME FedWatch tools indicate that there is currently a close to 70% chance of a 1/4 basis point rate cut next March, while there […]
2023-12-18 @ 11:25
After the Fed. Meeting last week, gold climbed above 2000, while the market refocused on an early rate cut next year. Powell’s dovish comments further tuned the market’s sentiments; the latest CME FedWatch tools indicate that there is currently a close to 70% chance of a 1/4 basis point rate cut next March, while there is almost 95% chance of a 1/4 basis point rate cut in May next year. On the day of the Fed meeting, gold prices rose nearly $50(1), and technically, it is currently neutralizing the selling pressure that occurred from the 2146 drop on December 4th.
1-hour chart – In the past 48 hours, gold prices have been oscillating within the 2020-50 range(2). There hasn’t been a significant trading volume that would lead to a breakout from the range. Until gold can break free from this range, take advantage of the S-T range(2). There haven’t been any important economic data releases at the beginning of this week. However, if further consolidation occurs later this week, the next range to watch out for would be between 2000-20(4). The descending trend line(3) still needs confirmation but can still serve as a reference for S-T strategies.
Daily chart – Currently, gold prices are finding support at 2017 – 20 MA(5). There is still relatively strong selling pressure around the 2035-47 range (6). For S-T trading on the daily chart, 2017-47 should be the range for now. If the gold price can close within or above the 2035-47 range by the end of this week, it would be the first signal that gold prices are preparing to test a new high.
                   S-T ressitance 3

                                            2015

                   S-T ressitance 2

                                            2010

                   S-T ressitance 1

                                            2007

                                                Market price

                                                2002

                   S-T support 1

                                            2000

                   S-T support 2

                                            1994-5

                   S-T support 3

                                            1990
P. To
Risk Disclosure: Gold Bullion/Silver (“Bullion”) trading carries a high degree of risk, and may not be suitable for all investors. The high degree of leverage can work against you as well as for you. This article is for reference only and is not a solicitation or advice to trade any currencies and investment products . Before deciding to trade Bullion you should carefully consider your investment objectives, level of experience, and risk appetite. The possibility exists that you could sustain a loss of some or all of your initial investment or even more in extreme circumstances (such as Gapping underlying markets) and therefore, you should not invest money that you cannot afford to lose. You should be aware of all the risks associated with trading Bullion, and seek advice from an independent financial advisor if you require. Client should not make investment decision solely based on the point of view and information on this article.
2023-12-11 @ 10:46
The downward trend is still dominating. Keep an eye out this week for the US CPI and the Fed. Meeting. Gold took advantage of better-than-expected employment data in the US market last Friday, finally escaping the 2020-40(1) zone. The price hit a daily low of 1994 and closed at 2004 before the weekend, experiencing a […]
2023-12-11 @ 09:46
The downward trend is still dominating. Keep an eye out this week for the US CPI and the Fed. Meeting.
Gold took advantage of better-than-expected employment data in the US market last Friday, finally escaping the 2020-40(1) zone. The price hit a daily low of 1994 and closed at 2004 before the weekend, experiencing a $24 drop throughout the day.
1-hour chart – After experiencing extreme volatility last Monday, gold prices have been claimed throughout last week. Following the 2020(1) support level breach, prices have stepped to the next range of 2000-20(2). The support level is now at 2000, with a short-term rebound target around 2018-20. Until a bottoming signal emerges, the initial downside target is around 1980, with the key focus on Wed’s Federal meeting.
Daily chart – After breaking out of the ascending channel (4) last Friday, we can expect a round of selling in S-T. The resistance is currently at 20 MA(5), while the downside target is around 1978(7) for a 50% retracement. Last Monday’s topping signal(6) continues to dominate the daily chart trend and needs to be digested further in the market. The basic structure needs to be adjusted toward near 1910-40.
                   S-T ressitance 3

                                            2047

                   S-T ressitance 2

                                            2038-40

                   S-T ressitance 1

                                            2030-31

                                                Market price

                                                2021

                   S-T support 1

                                            2017

                   S-T support 2

                                            2007-10

                   S-T support 3

                                            2000
P. To
Risk Disclosure: Gold Bullion/Silver (“Bullion”) trading carries a high degree of risk, and may not be suitable for all investors. The high degree of leverage can work against you as well as for you. This article is for reference only and is not a solicitation or advice to trade any currencies and investment products . Before deciding to trade Bullion you should carefully consider your investment objectives, level of experience, and risk appetite. The possibility exists that you could sustain a loss of some or all of your initial investment or even more in extreme circumstances (such as Gapping underlying markets) and therefore, you should not invest money that you cannot afford to lose. You should be aware of all the risks associated with trading Bullion, and seek advice from an independent financial advisor if you require. Client should not make investment decision solely based on the point of view and information on this article.
2022-10-19 @ 11:32
Gold traded in a tight range yesterday. The overall daily movement was pretty much like the day before – pulling back before the day’s end.; the price climbed to the day-high 1660 in the early session and retraced back to the opening price of 1650 before the day’s end. The S-T trend is still controlled […]
2022-10-19 @ 10:32
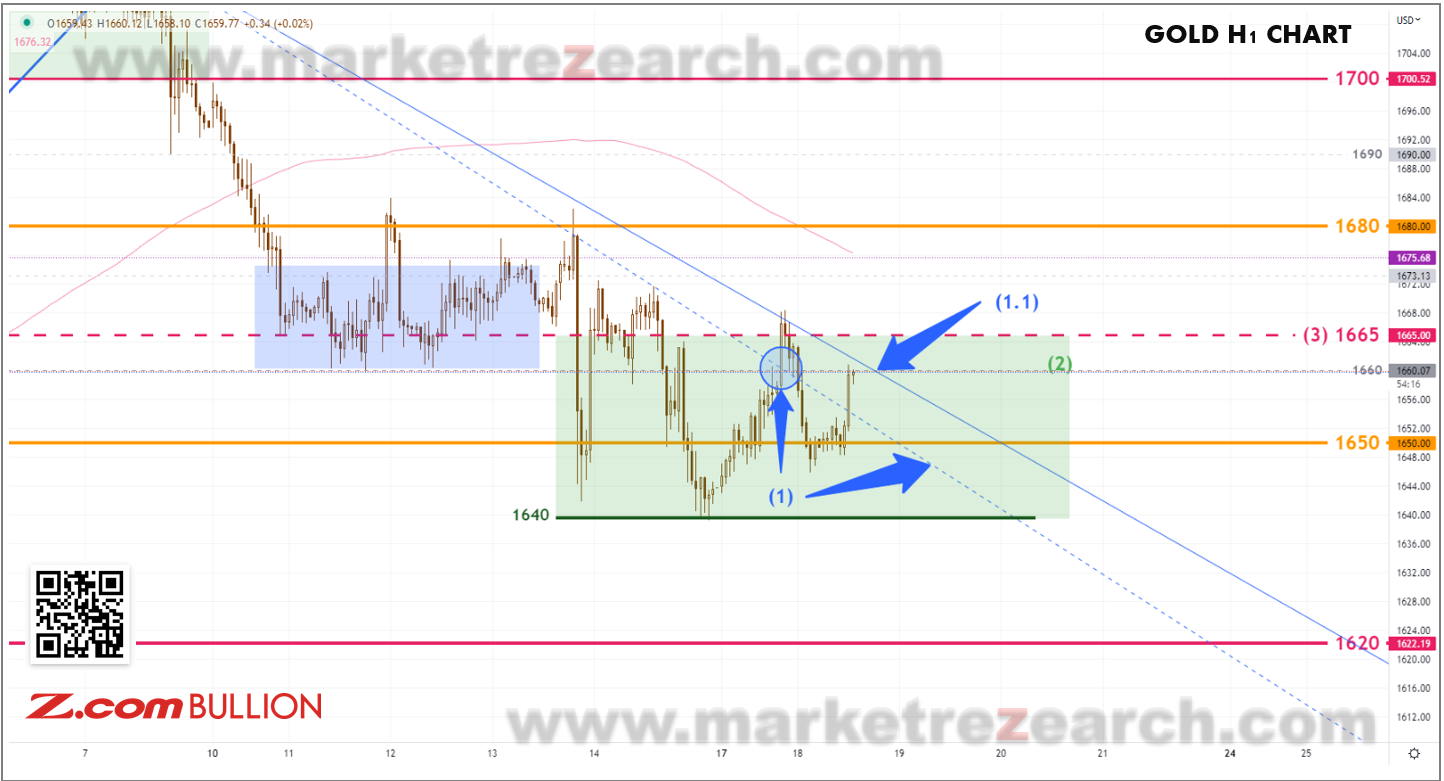
Gold traded in a tight range yesterday. The overall daily movement was pretty much like the day before – pulling back before the day’s end.; the price climbed to the day-high 1660 in the early session and retraced back to the opening price of 1650 before the day’s end.
The S-T trend is still controlled by the S-T downtrend resistance (1.1) that was mentioned yesterday. Overall, the market is bearish. However, the short-selling before 1650 is still relatively weak. Due to the lack of momentum, expect the price to remain within 1640-65(2) until it escapes.
The pullbacks before the day’s end on the second consecutive day have created another bearish signal on the daily chart. Wait for the signal; a new round of selling should only begin if the price close below 1650 on the daily chart; before that, the price should continue to wander around 1650.
S-T Resistances:
1665
1660
1655
Market price: 1651
S-T Supports:
1650
1645
1640
Risk Disclosure: Gold Bullion/Silver (“Bullion”) trading carries a high degree of risk, and may not be suitable for all investors. The high degree of leverage can work against you as well as for you. This article is for reference only and is not a solicitation or advice to trade any currencies and investment products . Before deciding to trade Bullion you should carefully consider your investment objectives, level of experience, and risk appetite. The possibility exists that you could sustain a loss of some or all of your initial investment or even more in extreme circumstances (such as Gapping underlying markets) and therefore, you should not invest money that you cannot afford to lose. You should be aware of all the risks associated with trading Bullion, and seek advice from an independent financial advisor if you require. Client should not make investment decision solely based on the point of view and information on this article.
2022-10-18 @ 14:08
Gold had pullback before the day’s end yesterday. The market opened at 1642 back from the weekend. The price has kept moving higher in the Asian and European sessions. It hit the day-high 1668 at the US session opening, then the price retraced. The day ended at 1650, up by USD8 after all. The downtrend […]
2022-10-18 @ 13:08
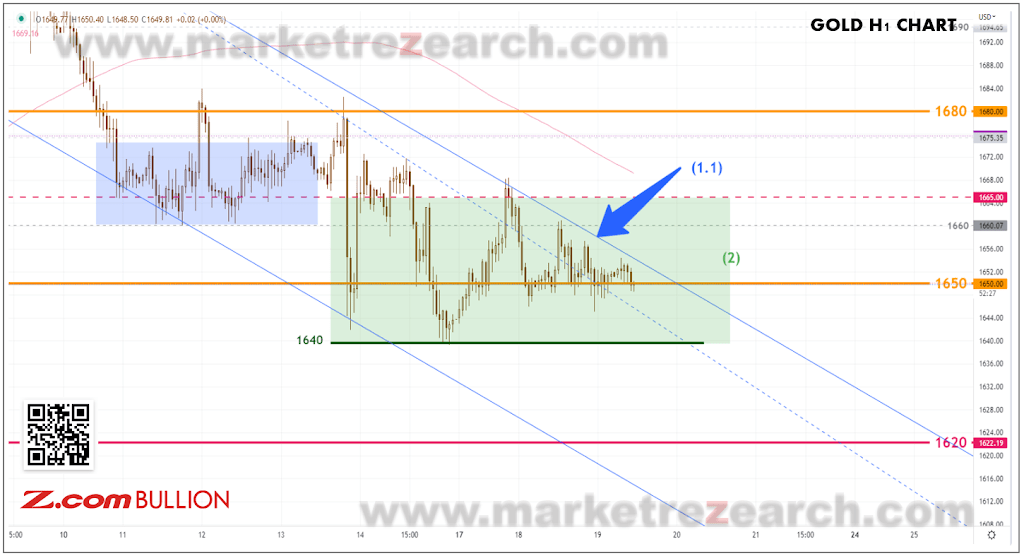
Gold had pullback before the day’s end yesterday. The market opened at 1642 back from the weekend. The price has kept moving higher in the Asian and European sessions. It hit the day-high 1668 at the US session opening, then the price retraced. The day ended at 1650, up by USD8 after all.
The downtrend on the 1-hour chart slowed down yesterday after the price jumped above the trendline(1), shifting the S-T downtrend from (1) to (1.1). Before the next break, expect the price to settle in between 1640-65(2) for now.
Overall the trend is still bearish, and a new bearish signal(3) has appeared after the pullback from 1668 yesterday. The resistance at 1665(4) & the 20 days MA(5) are blocking all the climb for now. Once the price clears the support at 1640, gold should be able to consolidate further.
S-T Resistances:
1670
1665
1660
Market price: 1659
S-T Supports:
1655
1650
1645
Risk Disclosure: Gold Bullion/Silver (“Bullion”) trading carries a high degree of risk, and may not be suitable for all investors. The high degree of leverage can work against you as well as for you. This article is for reference only and is not a solicitation or advice to trade any currencies and investment products . Before deciding to trade Bullion you should carefully consider your investment objectives, level of experience, and risk appetite. The possibility exists that you could sustain a loss of some or all of your initial investment or even more in extreme circumstances (such as Gapping underlying markets) and therefore, you should not invest money that you cannot afford to lose. You should be aware of all the risks associated with trading Bullion, and seek advice from an independent financial advisor if you require. Client should not make investment decision solely based on the point of view and information on this article.