2024-05-06 @ 10:17
國際金價上週尾段3次下試2280支持,最低曾觸及近4週低位2277,但受相對中性的美聯儲會後聲明及較弱的就業數據影響,金價最終守住2280支持。上週消息過後,美元走勢已短線轉弱,本週早段相信金價將承接上週尾段觸底後展開短線反彈。 1小時圖 – 金價上週3次測試2280(4)支持,但每次都即時反彈,反映2280-5(4)買盤支持強勁。週未過後金價在週一早段亞盤已突破下降阻力線(1),源自4月20日的下跌趨勢正式完結,上方短線目標可定在2328(2)。本週沒有任何重要經濟數據,只要金價在本週中後段上破2328,第二目標可定在2350(3)。 日線圖 – 現時金價仍未能停留在2300(7)以下超過1日,反映2300買盤支持仍然較強。短線阻力可繼續操作10天移動平均線(5)及20天線(6),把握2280-2355(8)區間,以現時市場狀況,相信金價需更多消息刺激才能離開2280-2355(8)區間。 P. To
2024-04-29 @ 11:46
Gold fell to a 2-week low of 2391 at the beginning of last week, but buying has resumed after a weaker-than-expected US GDP Q1 data, leading the price to reach 2352 before the US session on Friday. There were no surprises in the release of the U.S. inflation figures on that day; therefore, the market was relatively quiet before the weekend. Two major U.S. economic news are expected this week: the Fed. meeting on May 1st and the U.S. employment figures on Friday. As geopolitical risks in the Middle East fade out, the U.S. interest rate trend will now become the focal point of gold traders. According to CME FedWatch, 99.5% of the chances that the Fed. will keep interest rates unchanged this week (Unchanged – 97% in June / Unchanged – 68% in July). Expect the market to stay in a tight range before the Fed. meeting. If the Fed. announcement leans toward a more hawkish tone, just like Powell’s speech 2 weeks back; some more selling momentum will add to the gold price.
1-Hr Chart—Gold prices broke out from the S-T uptrend channel(1.1) in the Asian session early Monday. As the price escape channel(1), the upward momentum is now slowing down. Take advantage of the 2318-55(2) range in S-T until the Fed. meeting. If gold prices fall below the 2318-28 support zone earlier than expected, the next support level will be at 2300, and the descending channel (3) will dominate the trend for the rest of the week.
Daily Chart – The price fell back below the 20-day MA(5) after the rejection of the 10-day MA(4) last Friday, and the short-selling pressure has been increasing since then. The Fed announcement should dominate the gold price trend in the coming weeks; be patient with the news and the breakout caused by it. Before the next major move, trade the 2290-2351(6) range. If gold prices fall further, the next target will be near 2260(7).
P. To
2024-04-29 @ 10:55
黃金在上週初亞盤失守2318-28支持區後,跌至一週低位2391,但隨後受較弱的美國GDP數據刺激,在週五美盤前反彈至全週最高2352。上週五美國通脹數字沒有任何驚喜,金價走勢未出現明確大方向。本週兩大美國重磅消息: 香港時間週四凌晨美聯儲議息會議及週五美國就業數據。在中東地緣風險放緩的情況下,美國息率動向將暫時主導金市,利淡金價。跟據CME FedWatch, 現時5月99.5%維持息率不變,6月息率不變機會率已升至97%,而7月息率不變亦升至68%。在週四美聯儲會議前,相信市場會暫時以區間震蕩為主,等待消息公佈。 1小時圖 – 上週中段金價一直沿短上升通道(1)往上反彈,但今早亞盤已成功脫離(1.1)。上升趨勢正式放慢後,短線可把握2318-55(2)區間操作,直至美聯儲議息會議。若金價提早跌穿2318-28支持區,下方支持會在2300,而下降通道(3)將主導本週餘下時間的走勢。 日線圖 – 上週五反彈至10天移動平均線(4)後,週一亞盤價格已回落至20天移動平均線(5)之下,沽空壓力正在增加。日線圖暫時形成2290-2351(6)區間,有待突破。等待本週美聯儲會後聲明公佈,消息相信會主導金價中線走勢。若金價進一步回落,下一目標可定在2260(7)附近。 P. To
2024-04-22 @ 11:54
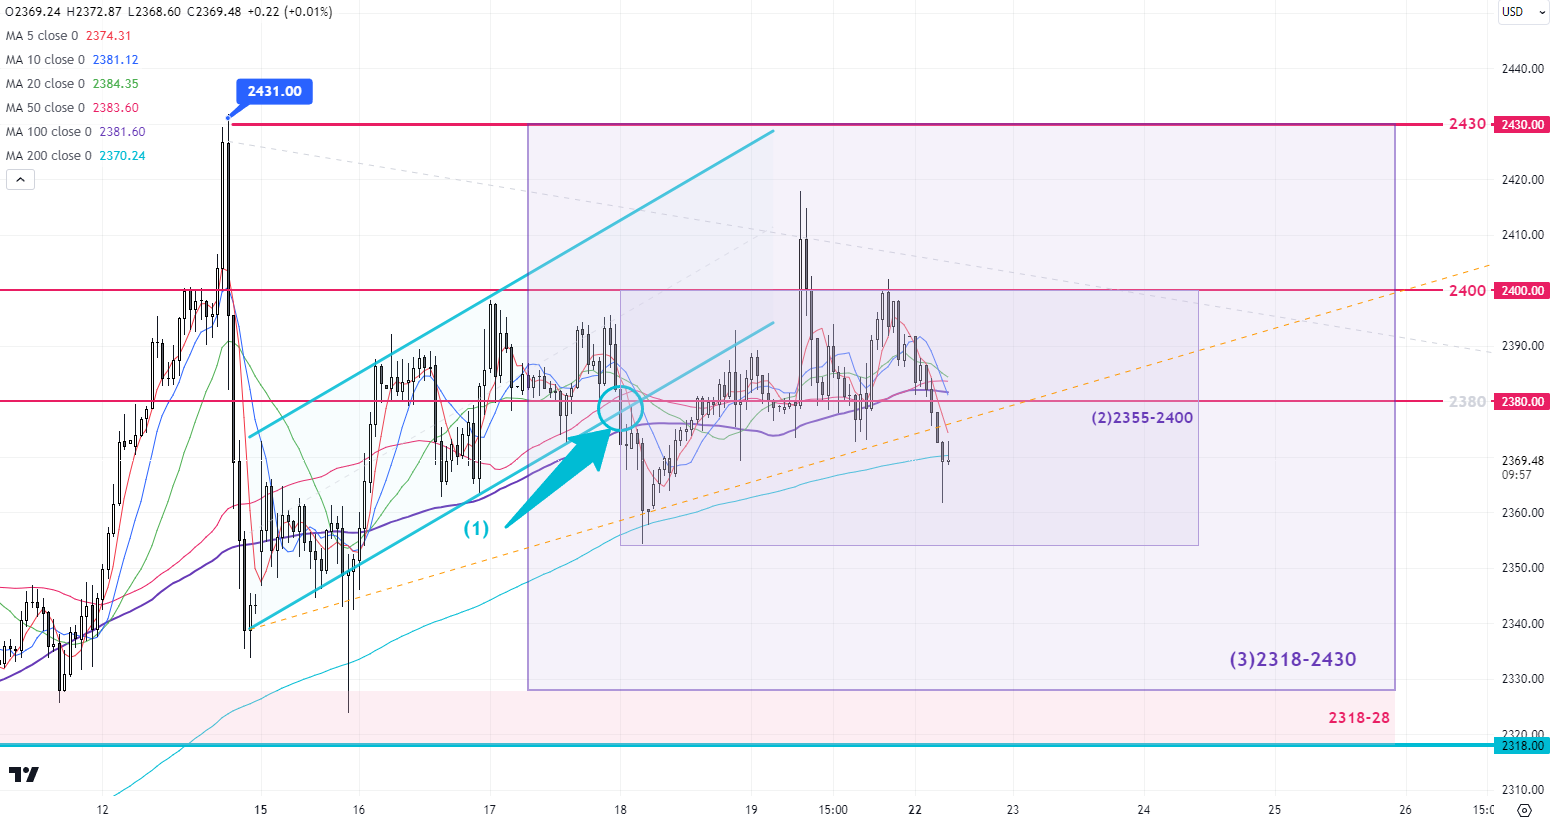
黃金上週走勢整體合乎預期,在高位橫行震蕩,未有突破。上週金市繼續被伊朗/以色列消息帶動,但自從伊朗在前週未首輪報複過後,市場對這方面消息已漸漸消化。上週五就算以色列作出相對反擊,金價亦只能沖上2420,很快已重回2400之下,相信本週地緣政治消息暫時難以讓金價再創新高。唯本週尾段必須留意週五的PCE通脹數據,雖然近期美國通脹有反彈跡象,但狀況其實仍跟財長耶倫3月初所講相差不遠,未算出現任何失控,週未前或會波幅擴大,但未必會有明顯突破,除非數據出現驚喜。 1小時圖 – 自從上週四金價擺脫上升通道(1)後,短線上升趨勢正式放緩,預期本週初走勢相對窄幅2355-2400(2)。週中過後波幅應會擴闊,以2318-2430(3)為操作區域。不確定性隱藏在週五的通脹數據,是否突破仍要等消息公佈前後。 日線圖 – 買盤在2400以上仍然較薄弱,未能將金價維系在2400之上。短線金價支持在10天移動均線(4),若價格進一步調整,下方須留意2314 – 20天移動均線(5)。金價兩試2400之上,現時沽盤(空單)在2400以上主導,若金價有一天在日線圖收盤在2400-30(6)內,將反映2400以上的沽盤已被清除,會是往上突破的第一個訊號。 短線阻力 3 2388-90 短線阻力 2 2380 短線阻力 1 2370-72 現價 2369 短線支持 1 2360 短線支持 2 2355 短線阻力 3 2350 P. To
2024-04-15 @ 11:44
The rapid retraction from the new high suggests the gold price has entered a short-term correction period.
Gold reached a new all-time high of 2431 last Friday after the US market opened, but the price quickly retreated. It lost key support of 2400 and 2380, falling back to the bottom support of Thursday near 2330, ending the weekly at 2343 with a slight increase of 13 dollars. The market had been anticipating retaliatory actions from Iran following the attack on the Iranian embassy in Syria, creating a relatively tense environment that led to the climb in gold prices in the past two weeks. There was noticeable profit-taking in the market, coincidentally 24 hours before Iran’s retaliation. After the long-awaited Iran’s retaliatory action, the risk sentiment decreased abruptly; although gold opened with a gap of around 10 dollars on Monday’s Asian session, the movement remained relatively calm. The S-T upward trend began to slow down after the rapid retracement on Friday. At this point, we can expect a range-bound consolidation to begin to form this week.
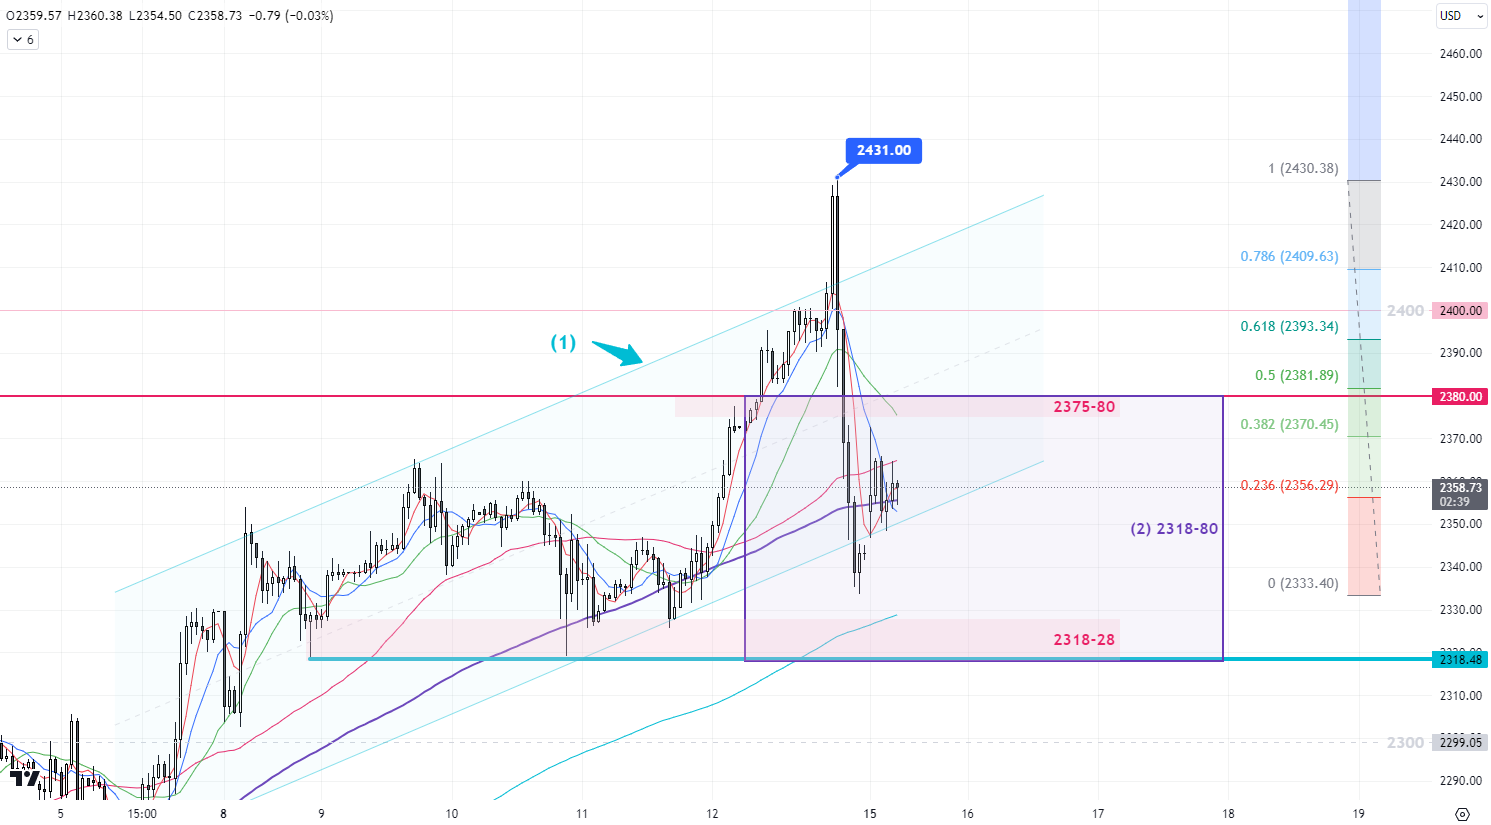
1-Hr Chart – The gold price has been steadily climbing along the upward trend channel(1) since it broke through the 2300 resistance at the night of the non-farm payroll at the beginning of the month. The price is still sitting within the upward channel(1). However, S-T resistance is expected around 2375-2380 after the market experienced significant volatility on Friday. For now, the trading range for this week can be set at around 2318-2380(2).
Daily Chart – After the reversal in gold price last Friday, there is a clear indication of a potential peak (3). As long as the closing price in the next two days remains below 2373 (4), a more noticeable correction is likely to occur. The initial target for this correction can be set around the 20-day moving average (5).
Monthly Chart – It is important to note that the gold price is approaching the upper boundaries of the long-term upward channels (6) and (7). For the upward trend to continue, the gold price must break through the resistance line at the top of the channels. Otherwise, a correction in the overall trend may be needed.
S-T ressitance 3
2380
S-T ressitance 2
2370-72
S-T ressitance 1
2365
Market price
2359
S-T support 1
2350-52
S-T support 2
2345
S-T support 3
2338-40
P. To
Risk Disclosure: Gold Bullion/Silver (“Bullion”) trading carries a high degree of risk, and may not be suitable for all investors. The high degree of leverage can work against you as well as for you. This article is for reference only and is not a solicitation or advice to trade any currencies and investment products . Before deciding to trade Bullion you should carefully consider your investment objectives, level of experience, and risk appetite. The possibility exists that you could sustain a loss of some or all of your initial investment or even more in extreme circumstances (such as Gapping underlying markets) and therefore, you should not invest money that you cannot afford to lose. You should be aware of all the risks associated with trading Bullion, and seek advice from an independent financial advisor if you require. Client should not make investment decision solely based on the point of view and information on this article.
2024-04-15 @ 11:01
黃金上週五美盤開市後創出歷史新高2431,但隨後快速回落,先後失守2400及2380關鍵支持,回落到週四早段的支持2330附近,收盤在2343,全週只上升13美元。金價自伊朗大使館在敘利亞受襲後,市場一直在等待伊朗的報複行動,處於相對緊張狀態,令金價持續爬升。而在伊朗正式報複前24小時,市場開始出現明顯獲利平倉,週一開市雖然金價裂口高開約10美元,但走勢相對穩定。伊朗報複行動過後,風險情緒驟減,加上金價經過週五高位拉回100美元,短線上升趨勢已開始放緩,初步預期本週會以區間調整為主。 1小時圖 – 金價自月初非農晚上突破2300阻力後,一直沿上升通道(1)往上。經過週五的大幅震蕩,雖然趨勢仍在上升通道當中,但預期2375-80會出現短線阻力,本週初步以2318-80(2)為操作區間。 日線圖 – 黃金自上週五的單日轉向後,出現明顯的見頂訊號(3),只要未來2日收市價低於2373(4),比較明顯的調整將會出現,第一目標暫時可定在20天移動均線(5)。 月線圖 – 須留意金價已貼近長線上升通道(6)和(7)的頂部,金價須突破通道頂部阻力線上升趨勢才能持續,否則整體趨勢須先作調整。 短線阻力 3 2380 短線阻力 2 2370-72 短線阻力 1 2365 現價 2359 短線支持 1 2350-52 短線支持 2 2345 短線阻力 3 2338-40 P. To
2024-03-25 @ 11:38
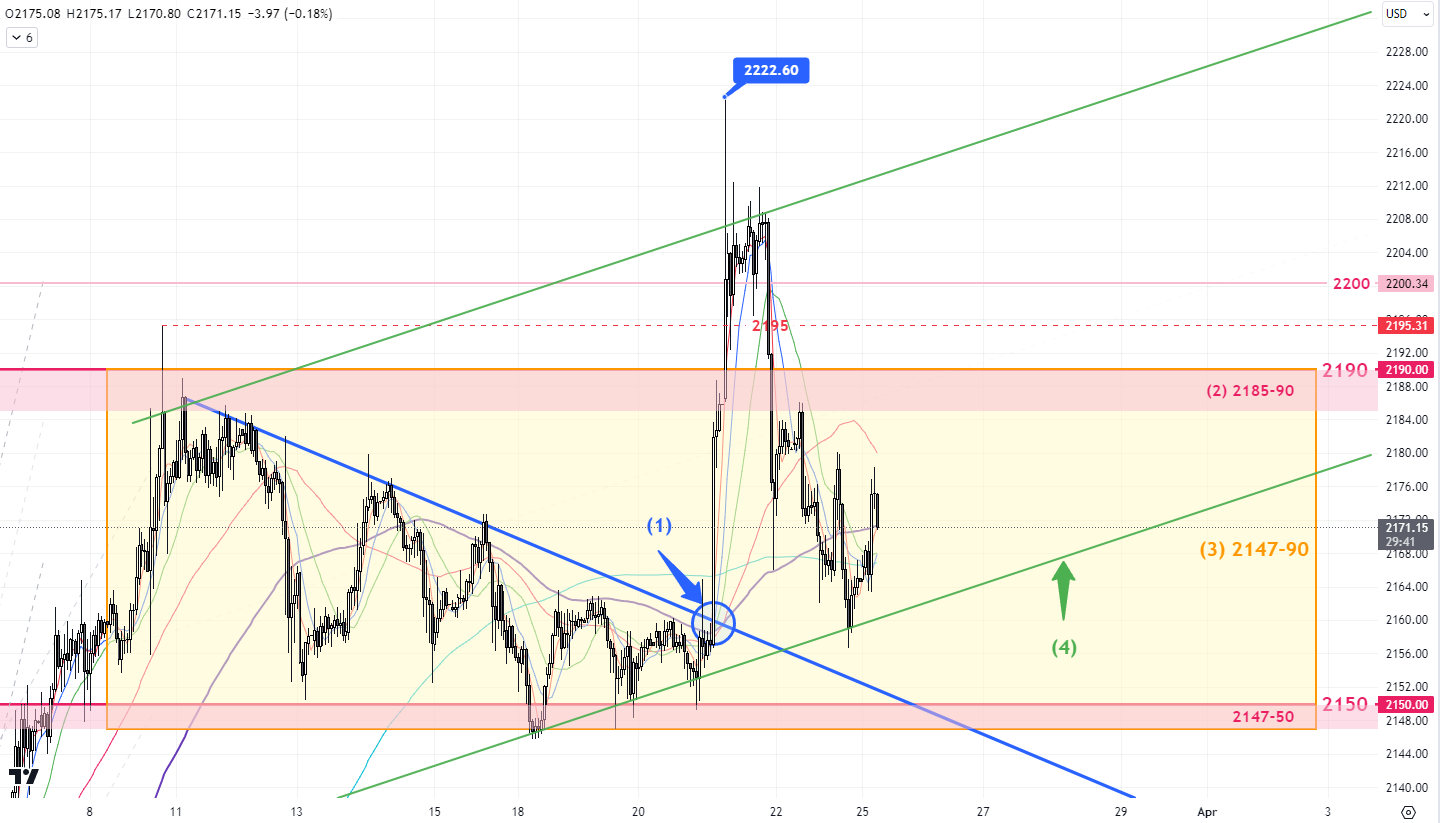
Following the Fed meeting, gold reached a new all-time high of 2222 last week. However, it failed to stay above 2200 and retraced quickly below the previous high of 2195 within 24 hours. This Friday is a US holiday, but the inflation data(PCE price index) will still be released. Make sure you pay close attention to market volatility at the late Friday session and the early Monday Asian session, and exercise caution in managing risks.
1-hr chart – The price broke through the S-T resistance(1) last week and reached our target range of 2185-2190 (2). Although it subsequently reached a new high, the price is now falling back to 2147-90(3). The resistance zone of 2186-90(2) is still valid. Take advantage of the rebound driven by the newly formed upward channel(4) at the beginning of this week, and expect the price to be bound within 2147-90 (3) in S-T until another news breaks out.
Daily chart – After the quick pull-back after the Fed. Meeting last week, a reserval signal(5) has appeared. Unless the gold price can close above 2190 on the daily chart, an S-T consolidation period is likely to occur in the next two weeks. Again, 2147 is the key support level, once its clear the next support will be at the 20-day MA.
S-T ressitance 3
2190
S-T ressitance 2
2185
S-T ressitance 1
2180
Market price
2175
S-T support 1
2168
S-T support 2
2165
S-T support 3
2155
P. To
Risk Disclosure: Gold Bullion/Silver (“Bullion”) trading carries a high degree of risk, and may not be suitable for all investors. The high degree of leverage can work against you as well as for you. This article is for reference only and is not a solicitation or advice to trade any currencies and investment products . Before deciding to trade Bullion you should carefully consider your investment objectives, level of experience, and risk appetite. The possibility exists that you could sustain a loss of some or all of your initial investment or even more in extreme circumstances (such as Gapping underlying markets) and therefore, you should not invest money that you cannot afford to lose. You should be aware of all the risks associated with trading Bullion, and seek advice from an independent financial advisor if you require. Client should not make investment decision solely based on the point of view and information on this article.
2024-03-25 @ 10:33
國際金價在上週美聯儲議息會議後再創歷史新高2222,但一閃過後未能企穩2200以上。價格在24小時內回到前高2195之下。本週五是美國假期,但仍會有通脹數據公佈,務必留意週五交易尾段及週一早段市場波動擴大情況,小心控制風險。 1小時圖 – 金價在上週突破短線下降阻力(1)後,直達我們目標2185-90(2)。隨後雖然再創新高,但金價未能維持在2190之上,重回2147-90(3)區間之內。本週初可留意剛形成短線上升通道(4)所帶動的趨勢反彈,把握上方關鍵阻力2186-90(2)阻力高位,相信本週價格會繼續2147-90(3)區間內震蕩,直到市場有新消息刺激。 日線圖 – 上週議息會議後的衝高回落,在圖表上出現明顯的調整訊號(5)。除非金價在日線圖能收盤在2190之上,否則上週提及的 “蘊醞更深調整” 在議息會議後/未來2週應會出現。繼續留意2147支持及20天移動均線。 短線阻力 3 2168 短線阻力 2 2160 短線阻力 1 2155 現價 2152 短線支持 1 2147-50 短線支持 2 2140 短線阻力 3 2130 P. To
2024-03-18 @ 10:39
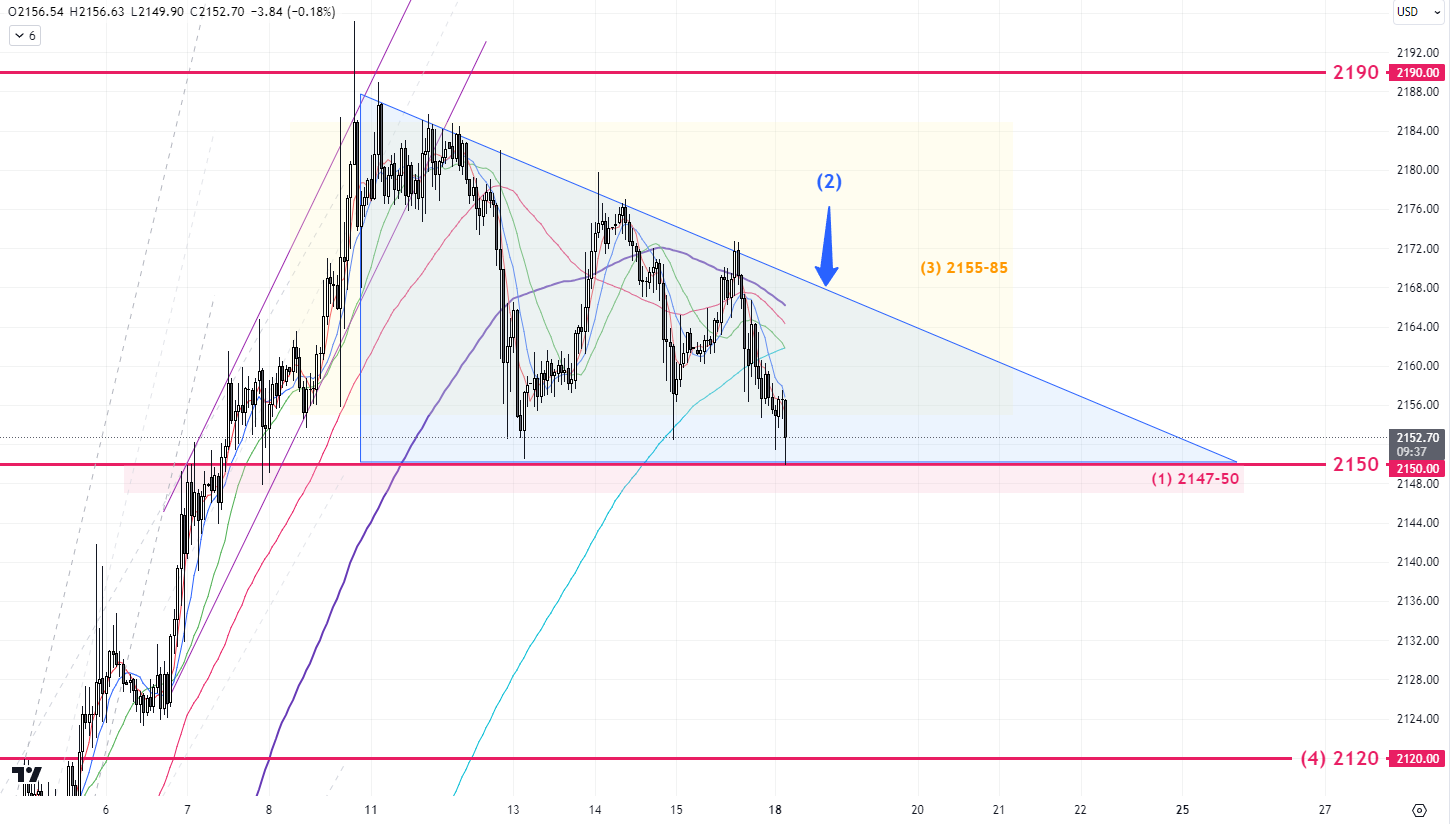
After reaching a new high of 2195, the gold price stayed sideways between 2155-85(1) last week. This week’s only major event will be the Fed meeting. Following the slight rebound in US core CPI data last week, expect the post-Fed meeting announcement to lean towards a hawkish stance, which could have a bearish impact on the gold price.
1-hr Chart – The gold price is still bounded within the range of 2155-85 (3), and it is currently trading under the S-T resistance line (2) that has been in place for the past few trading days. If the critical support level of 2147-2150(1) is breached, the next downside target can be set around 2120(4).
Daily Chart – Structurally, there hasn’t been any significant change on the daily chart, with the upward channel(5) remaining valid. The gold price is still standing above the previous high of 2147(7). If the buying support from the previous high of 2147(7) is cleared, a major correction toward 2120 should occur and pay attention to the next support at the 20-day MA(6).
S-T ressitance 3
2168
S-T ressitance 2
2160
S-T ressitance 1
2155
Market price
2152
S-T support 1
2147-50
S-T support 2
2140
S-T support 3
2130
P. To
Risk Disclosure: Gold Bullion/Silver (“Bullion”) trading carries a high degree of risk, and may not be suitable for all investors. The high degree of leverage can work against you as well as for you. This article is for reference only and is not a solicitation or advice to trade any currencies and investment products . Before deciding to trade Bullion you should carefully consider your investment objectives, level of experience, and risk appetite. The possibility exists that you could sustain a loss of some or all of your initial investment or even more in extreme circumstances (such as Gapping underlying markets) and therefore, you should not invest money that you cannot afford to lose. You should be aware of all the risks associated with trading Bullion, and seek advice from an independent financial advisor if you require. Client should not make investment decision solely based on the point of view and information on this article.
2024-03-18 @ 09:34
黃金自創出新高2195後,上週價格整體在高位橫行震蕩。本週唯一重點香港時間週四凌晨的美聯儲議息會議,經過上週稍微反彈美國核心CPI數據,相信本週會後聲明亦會偏鹰,利淡金價。 1小時圖 – 金價現時仍在2155-85(3)區間之內,過去一週的短線下降阻力線(2)繼續有效,美聯儲議息會議前可繼續參考。若失守2147-50(1)關鍵支持,下方目標可定在2120(4)。 日線圖 – 結構上未有明顯變化,上升通道(5)繼續有效。現時仍在前高位2147(7)之上,若往下調整留意下方20天移動均線(6)在2103附近。 短線阻力 3 2168 短線阻力 2 2160 短線阻力 1 2155 現價 2152 短線支持 1 2147-50 短線支持 2 2140 短線阻力 3 2130 P. To