Gold Trend 15/04
2024-04-15 @ 11:44
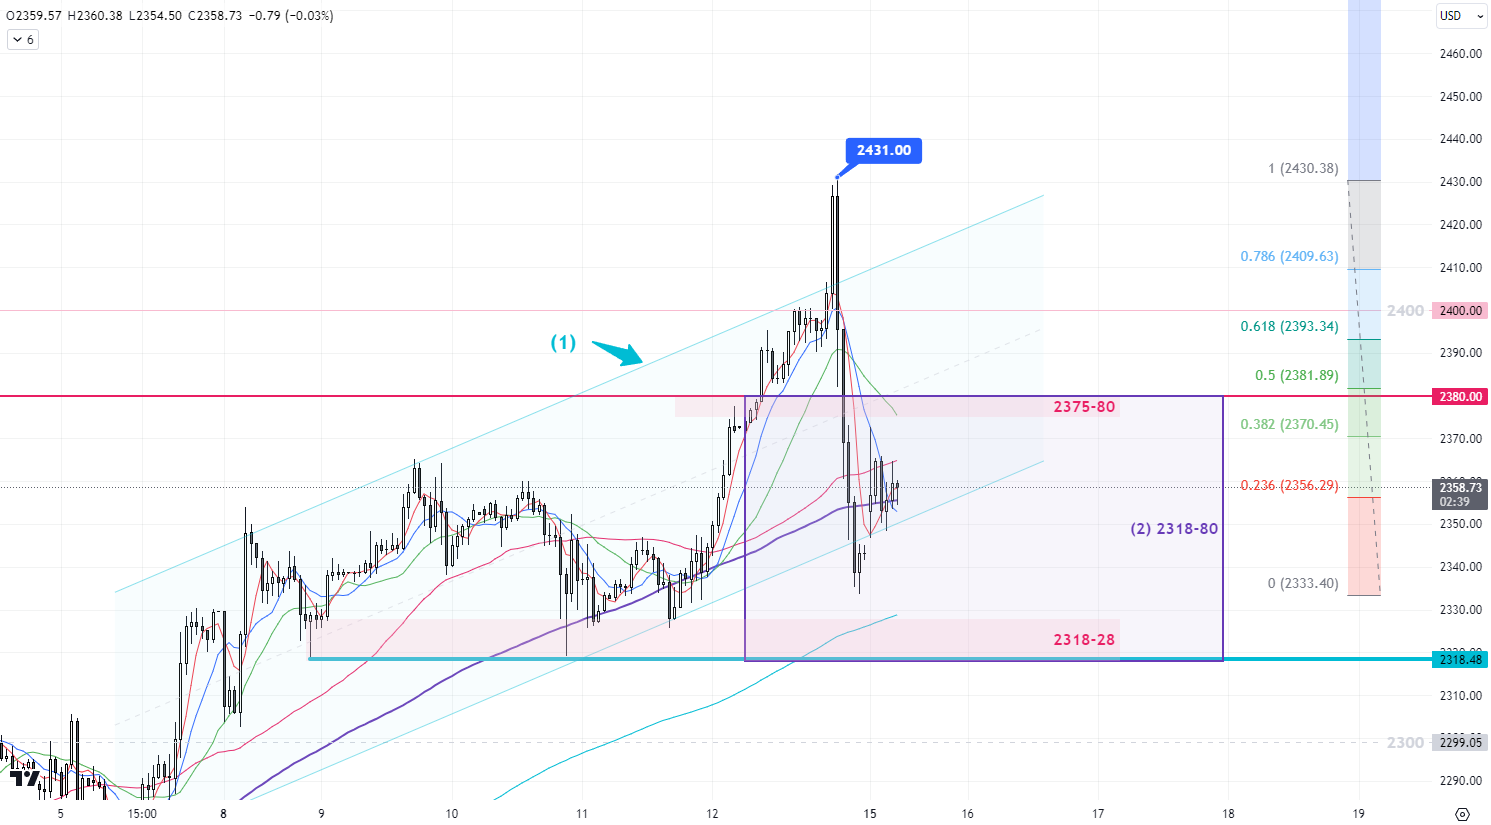
The rapid retraction from the new high suggests the gold price has entered a short-term correction period.
Gold reached a new all-time high of 2431 last Friday after the US market opened, but the price quickly retreated. It lost key support of 2400 and 2380, falling back to the bottom support of Thursday near 2330, ending the weekly at 2343 with a slight increase of 13 dollars. The market had been anticipating retaliatory actions from Iran following the attack on the Iranian embassy in Syria, creating a relatively tense environment that led to the climb in gold prices in the past two weeks. There was noticeable profit-taking in the market, coincidentally 24 hours before Iran’s retaliation. After the long-awaited Iran’s retaliatory action, the risk sentiment decreased abruptly; although gold opened with a gap of around 10 dollars on Monday’s Asian session, the movement remained relatively calm. The S-T upward trend began to slow down after the rapid retracement on Friday. At this point, we can expect a range-bound consolidation to begin to form this week.
1-Hr Chart – The gold price has been steadily climbing along the upward trend channel(1) since it broke through the 2300 resistance at the night of the non-farm payroll at the beginning of the month. The price is still sitting within the upward channel(1). However, S-T resistance is expected around 2375-2380 after the market experienced significant volatility on Friday. For now, the trading range for this week can be set at around 2318-2380(2).
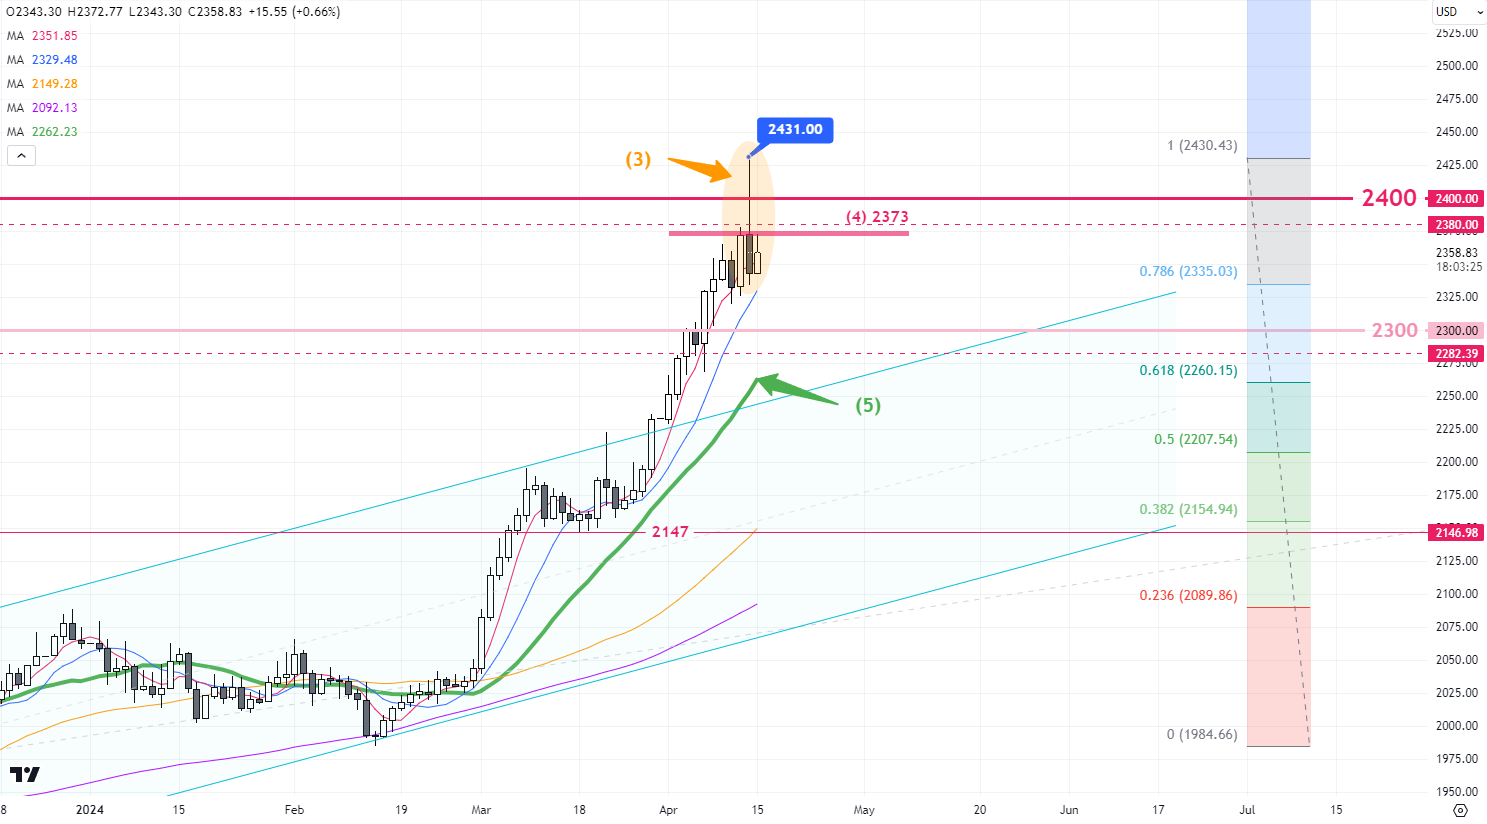
Daily Chart – After the reversal in gold price last Friday, there is a clear indication of a potential peak (3). As long as the closing price in the next two days remains below 2373 (4), a more noticeable correction is likely to occur. The initial target for this correction can be set around the 20-day moving average (5).
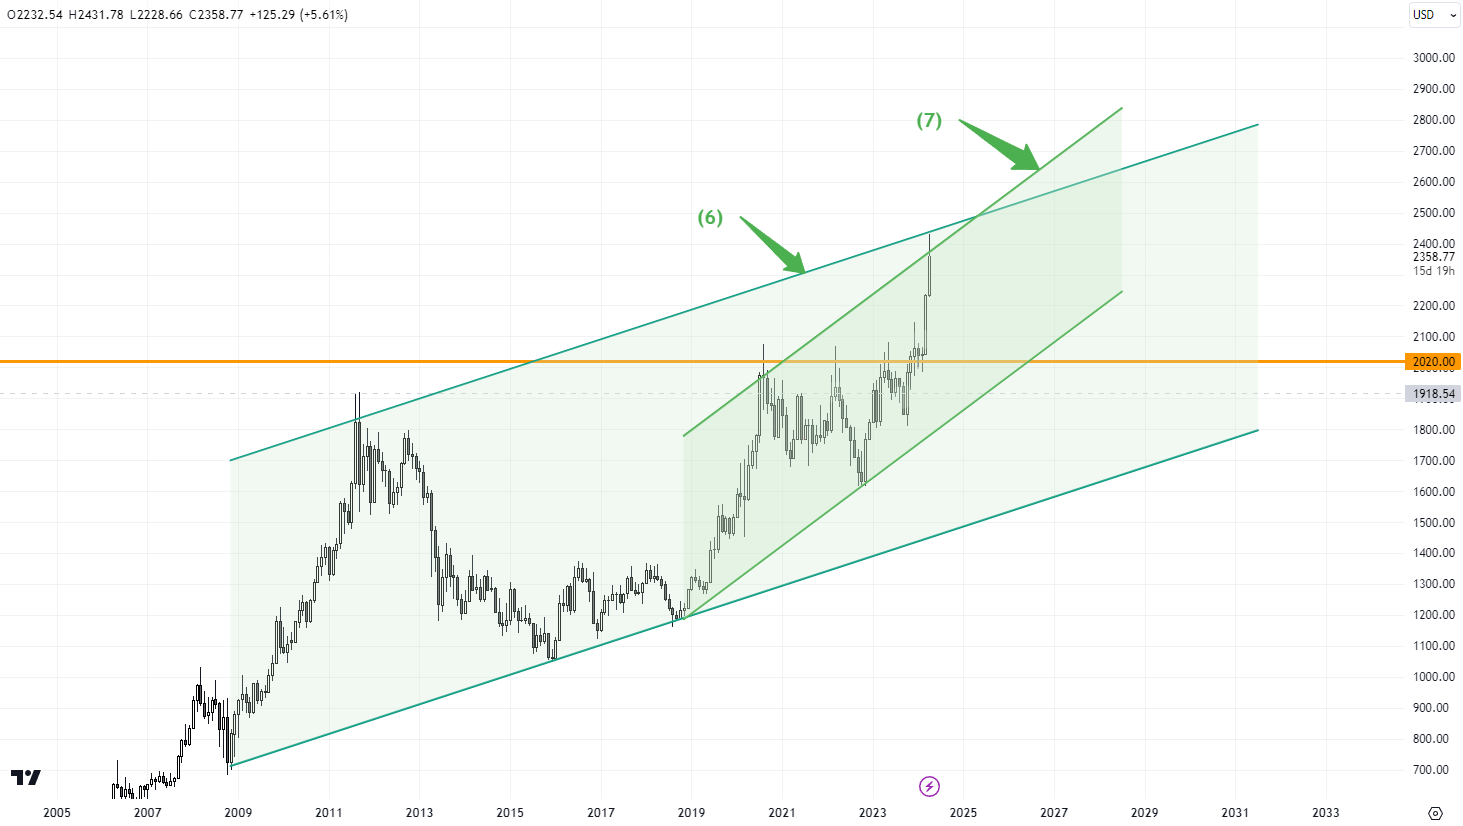
Monthly Chart – It is important to note that the gold price is approaching the upper boundaries of the long-term upward channels (6) and (7). For the upward trend to continue, the gold price must break through the resistance line at the top of the channels. Otherwise, a correction in the overall trend may be needed.
|
S-T ressitance 3 |
2380 |
|
S-T ressitance 2 |
2370-72 |
|
S-T ressitance 1 |
2365 |
|
Market price |
2359 |
|
S-T support 1 |
2350-52 |
|
S-T support 2 |
2345 |
|
S-T support 3 |
2338-40 |
P. To
Risk Disclosure: Gold Bullion/Silver (“Bullion”) trading carries a high degree of risk, and may not be suitable for all investors. The high degree of leverage can work against you as well as for you. This article is for reference only and is not a solicitation or advice to trade any currencies and investment products . Before deciding to trade Bullion you should carefully consider your investment objectives, level of experience, and risk appetite. The possibility exists that you could sustain a loss of some or all of your initial investment or even more in extreme circumstances (such as Gapping underlying markets) and therefore, you should not invest money that you cannot afford to lose. You should be aware of all the risks associated with trading Bullion, and seek advice from an independent financial advisor if you require. Client should not make investment decision solely based on the point of view and information on this article.