 |  |
| Gold V.1.3.1 signal Telegram Channel (English) | 黃金交易訊號 V.1.3.1 Telegram 群組 (中文) |
Gold Trend 09/03
2022-03-09 @ 15:17
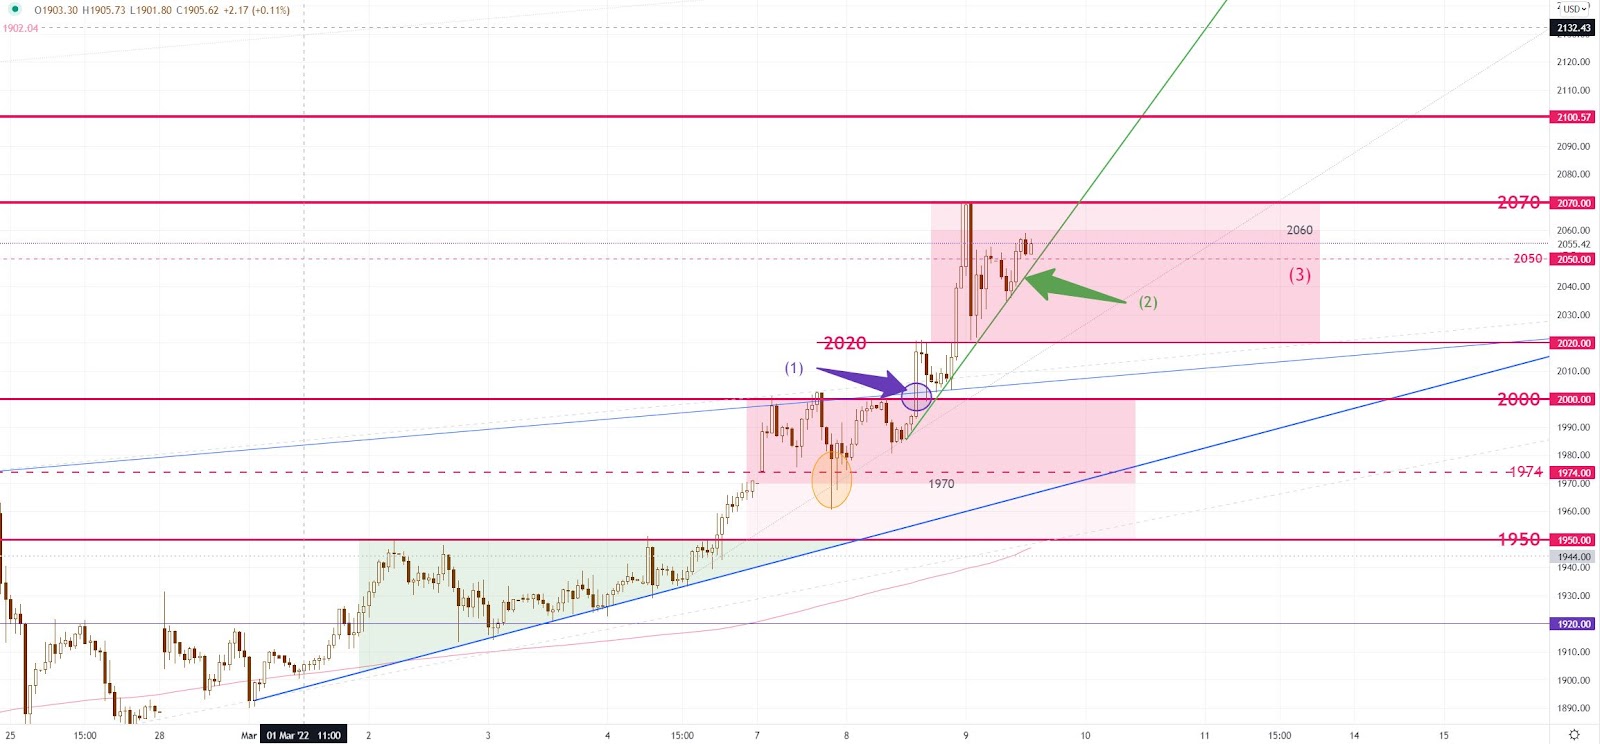
Gold run for the record high yesterday. The day began at 1997 early in the Asian session, and once it had breached the 2000 barrier, the price reached the early high at the 2020 level. The climb resumed at the US session, and it touched the day-high at 2070. The day finally ended at 2049, up by USD 52.
The high and low of 2020-70 at the US session yesterday has created an S-T trading range for today. Notice the gold price is not able to stay above 2062 for more than 15 mins so far. The buying was thin above 2060 with the actions dominated mainly by profit-taking. Before the next breakout, expect the price to be range-bound by 2030-60(3). If the price breaks the support of trendline(2) in S-T, the price will move toward the bottom of the range around 2030.
After the price cleared the major resistance 1950 last Friday, the price has reached our 2065 target yesterday. No reversal signal has yet appeared in the daily chart; the trend remains upward. Although the price is near the record high now, the price has more potential to move higher under the current market conditions. Before the breakout, expect the price to trade within 2000-65 range in the next two days.
S-T Resistances:
2068-72
2060
2055
Market price: 2053
S-T Supports:
2050
2040
2035
Risk Disclosure: Gold Bullion/Silver (“Bullion”) trading carries a high degree of risk, and may not be suitable for all investors. The high degree of leverage can work against you as well as for you. This article is for reference only and is not a solicitation or advice to trade any currencies and investment products . Before deciding to trade Bullion you should carefully consider your investment objectives, level of experience, and risk appetite. The possibility exists that you could sustain a loss of some or all of your initial investment or even more in extreme circumstances (such as Gapping underlying markets) and therefore, you should not invest money that you cannot afford to lose. You should be aware of all the risks associated with trading Bullion, and seek advice from an independent financial advisor if you require. Client should not make investment decision solely based on the point of view and information on this article.


![[每日收市 🔔] 黃金 – 紐約現貨黃金價格攻防激烈,市場對地緣政治風險和美元走勢高度敏感](https://1uptick.com/wp-content/uploads/2025/05/2025-05-22T235737.743Z-file-733x465.png)
![[每日收市 🔔] 黃金 – 現貨黃金價格週二上漲至新高,美元弱勢支撐推升避險買盤](https://1uptick.com/wp-content/uploads/2025/05/2025-05-22T004314.360Z-file-733x465.png)


