Gold Trend 26/02
The expectation of the Fed’s interest rate cuts continues to support the fundamentals of the gold price. However, since the market kept delaying the rate cuts schedule without significant economic news, gold was traded sideways above 2020 last week. More news is expected this week, with the US announcing durable goods orders, 4Q GDP, PCE inflation, and manufacturing PMI. Regardless of whether the data is better or worse than expectations, the daily price fluctuations of gold should be widened toward around the $20 range. Considering the current market sentiment, unless these data significantly exceed expectations, it will not be easy for gold to break free from the current sideway sentiment. Therefore, we can continue to take advantage of the 2015-2040 range this week.
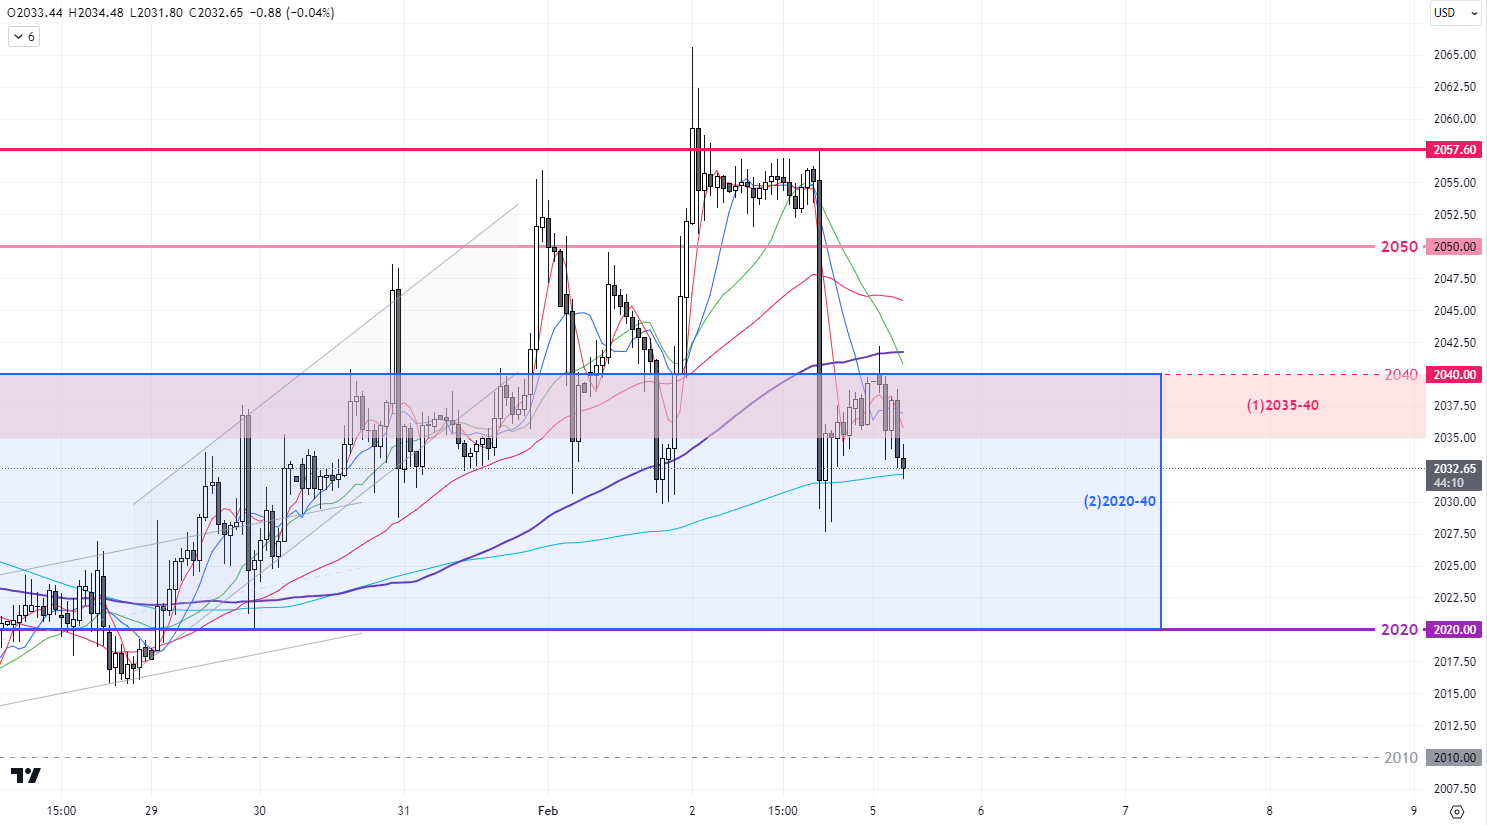
1hr chart – Last week, the daily price fluctuations of gold expanded from a narrow range at the beginning of the week to a broader USD 25 range (1) near the week’s end. The market dynamics should be similar to last Fri. on data release days this week. The resistance zone around 2035-2040 is still valid, and the day trading strategy should continue to be based on the range of 2015-40.
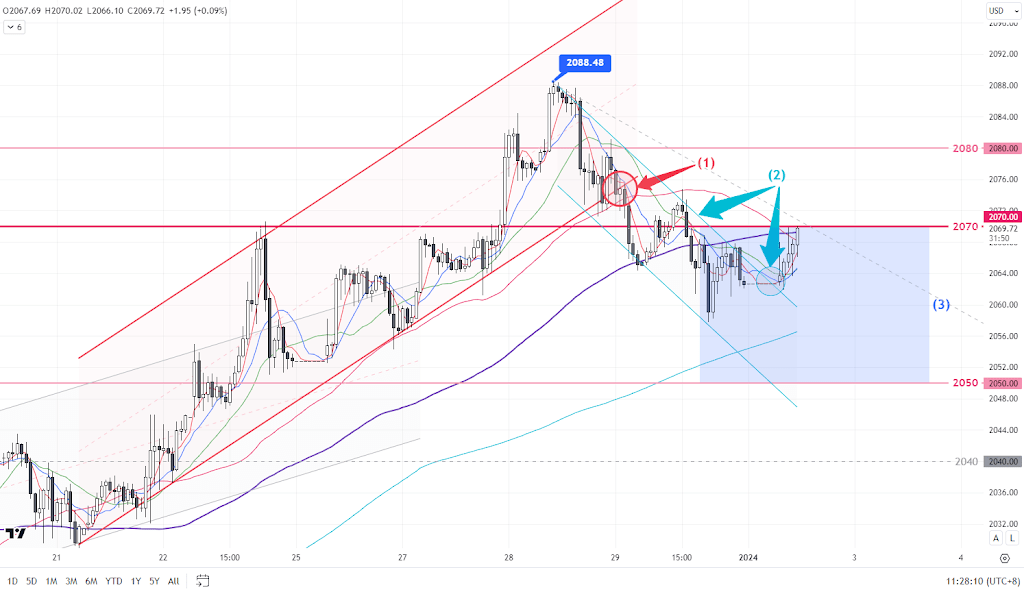
Daily Chart – After the rejection of 2041 on Friday, the rebounding cycle from the bottom of the downward channel(3) is getting close to an end. Short-selling near 2040 in the next 1-2 days will be ideal if the gold price is to touch 2040 again. Once the price falls below the 20-day ma(4) near the end of this week, the adjustment target can be set at 2010 or even lower for next week.
                   S-T ressitance 3

                                            2045

                   S-T ressitance 2

                                            2040

                   S-T ressitance 1

                                            2035

                                                Market price

                                                2031

                   S-T support 1

                                            2030

                   S-T support 2

                                            2025

                   S-T support 3

                                            2018-20
P. To
Risk Disclosure: Gold Bullion/Silver (“Bullion”) trading carries a high degree of risk, and may not be suitable for all investors. The high degree of leverage can work against you as well as for you. This article is for reference only and is not a solicitation or advice to trade any currencies and investment products . Before deciding to trade Bullion you should carefully consider your investment objectives, level of experience, and risk appetite. The possibility exists that you could sustain a loss of some or all of your initial investment or even more in extreme circumstances (such as Gapping underlying markets) and therefore, you should not invest money that you cannot afford to lose. You should be aware of all the risks associated with trading Bullion, and seek advice from an independent financial advisor if you require. Client should not make investment decision solely based on the point of view and information on this article.