2022-10-12 @ 13:02
Gold touched a new 1-week low yesterday. The day began at 1667, and the price was traded between 1660-71 throughout the Asian & European sessions. A rapid jump to the day-high 1684 occurred at the US session, but the price got pull-back led to the day ending at 1665, down by USD 2. The S-T […]
2022-10-12 @ 12:02
Gold touched a new 1-week low yesterday. The day began at 1667, and the price was traded between 1660-71 throughout the Asian & European sessions. A rapid jump to the day-high 1684 occurred at the US session, but the price got pull-back led to the day ending at 1665, down by USD 2.
The S-T selling trend originated from 1710 has ended yesterday after the price climbed above the downward trendline(1). Waiting for the US Fed. Minutes later today, the price is settling in a tight range between 1660-80(2).
Gold’s pull-back from 1684 yesterday has created a selling signal(4) on the daily chart. The trend on the daily chart remains bearish, and the resistance at the 20-day MA(5) remains in effect.
S-T Resistances:
1680
1676
1670
Market price: 1667
S-T Supports:
1665
1660
1655
Risk Disclosure: Gold Bullion/Silver (“Bullion”) trading carries a high degree of risk, and may not be suitable for all investors. The high degree of leverage can work against you as well as for you. This article is for reference only and is not a solicitation or advice to trade any currencies and investment products . Before deciding to trade Bullion you should carefully consider your investment objectives, level of experience, and risk appetite. The possibility exists that you could sustain a loss of some or all of your initial investment or even more in extreme circumstances (such as Gapping underlying markets) and therefore, you should not invest money that you cannot afford to lose. You should be aware of all the risks associated with trading Bullion, and seek advice from an independent financial advisor if you require. Client should not make investment decision solely based on the point of view and information on this article.
2022-10-11 @ 13:10
Carried the selling momentum from last Fri., gold sank further yesterday. The market opened at 1694 back from the weekend. After the price briefly touched 1700 during the opening hours, the bearish run began. It cleared the 1680 support in the US opening session and landed at the day-low near 1665. The day ended at […]
2022-10-11 @ 12:10
Carried the selling momentum from last Fri., gold sank further yesterday. The market opened at 1694 back from the weekend. After the price briefly touched 1700 during the opening hours, the bearish run began. It cleared the 1680 support in the US opening session and landed at the day-low near 1665. The day ended at 1668, down by USD 25.
Selling resumed after the US employment figures last Fri. After it cleared the 1700 support, an S-T resistance line(2) formed in the past 24 hours; the downward trend should continue before the price breakout from this trendline(2). The next critical support is near 1650(4) for now.
A bottoming signal has yet to appear in the daily chart, where the 20-day MA become the upside resistance again. Gold should touch a new weekly low today. Within the next 24 hours, let’s see if the price can resuming its position within its previous 1653-88(5) trading zone.
S-T Resistances:
1676
1670
1665
Market price: 1663
S-T Supports:
1660
1655
1650
Risk Disclosure: Gold Bullion/Silver (“Bullion”) trading carries a high degree of risk, and may not be suitable for all investors. The high degree of leverage can work against you as well as for you. This article is for reference only and is not a solicitation or advice to trade any currencies and investment products . Before deciding to trade Bullion you should carefully consider your investment objectives, level of experience, and risk appetite. The possibility exists that you could sustain a loss of some or all of your initial investment or even more in extreme circumstances (such as Gapping underlying markets) and therefore, you should not invest money that you cannot afford to lose. You should be aware of all the risks associated with trading Bullion, and seek advice from an independent financial advisor if you require. Client should not make investment decision solely based on the point of view and information on this article.
2022-10-07 @ 11:15
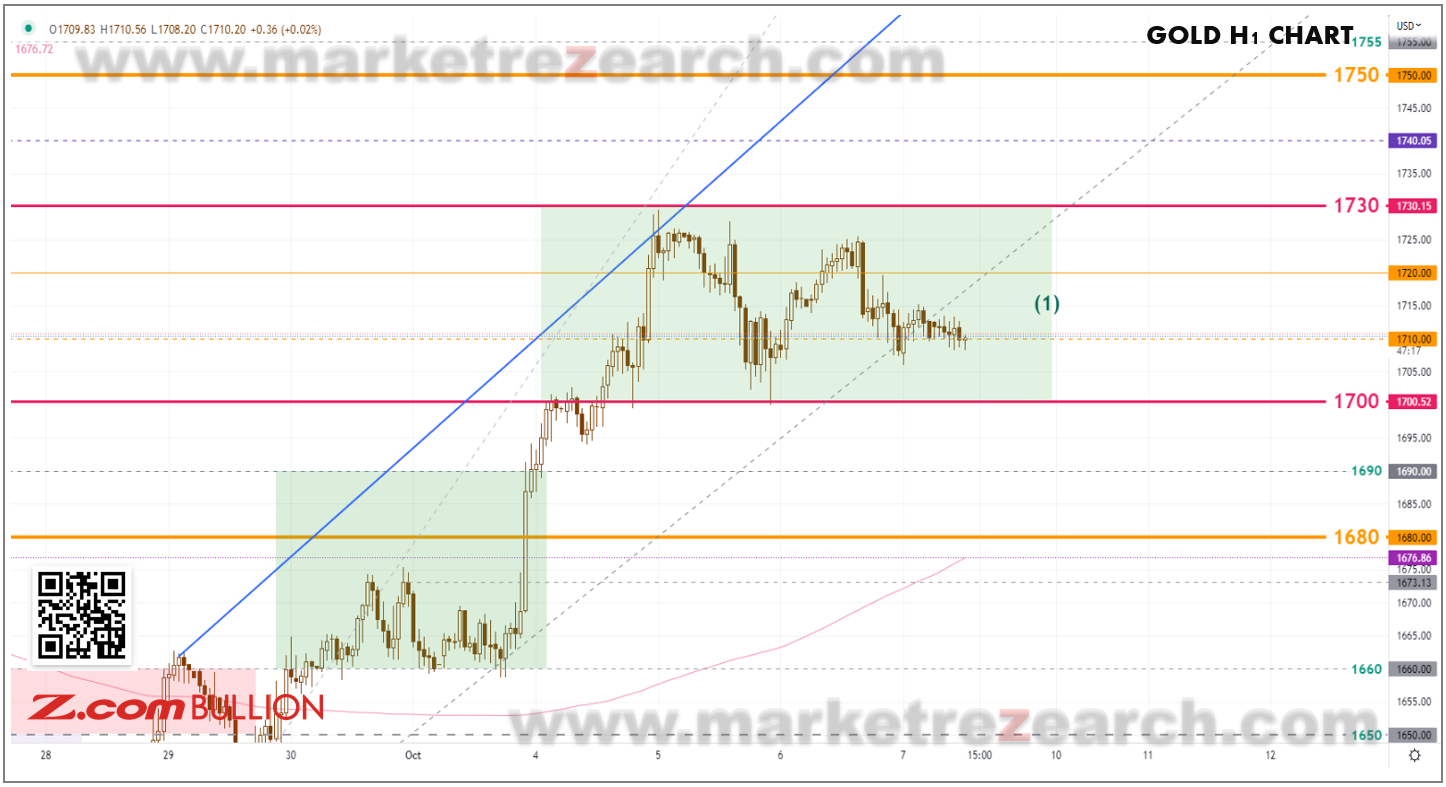
黃金昨日繼續在窄幅區間內震蕩。全日開盤在1716,歐盤前試全日高位1725後開始回落。美盤交易中段回調至全日最低1706,全日在1711收市,微跌5美元。 黃金未能穿透1730阻力,短線上升趨勢在過去48小時暫時停止。如前日提及,在美公佈就業數據前可繼續把握1700-30(1)區間操作。等待明確方向,若黃金跌穿1700,下方目標初步可定在1680附近。 黃金繼續受阻於上方的50天移動平均線(2),現時在貼近3週高位,日線圖趨勢上未有明確方向。若日內數據觸發調整,下方目標可定在20天移動平均線(3)。若突破往上,目標可定在1750-55。 短線阻力: 1730 1725 1720 現價:1711 短線支持: 1710 1705 1700 風險提示: 場外式黃金/白銀交易涉及高度風險,未必適合所有投資者。高度的槓桿可為閣下帶來負面或正面的影響。閣下在決定買賣場外式黃金/白銀之前應審慎考慮自己的投資目標、交易經驗以及風險接受程度。可能出現的情況包括蒙受部分或全部初始投資額的損失,或在極端情況下(例如相關市場跳空)產生更多的損失。因此,閣下不應將無法承受損失的資金用於投資。投資應知悉買賣場外式黃金/白銀有關的一切風險,如有需要,請向獨立財務顧問尋求意見。市場資料僅供參考,Z.com Bullion 絕不保証分析內容的準確性。
2022-10-05 @ 13:28
Gold renewed the 3-weeks high yesterday. Carried the buying momentum from the day before, a new round of buying was triggered after the price cleared the resistance at 1700 early in the Asian session. The bullish trend continued until it touched the day-high near 1729 late in the US session. The day ended at 1725, […]
2022-10-05 @ 12:28
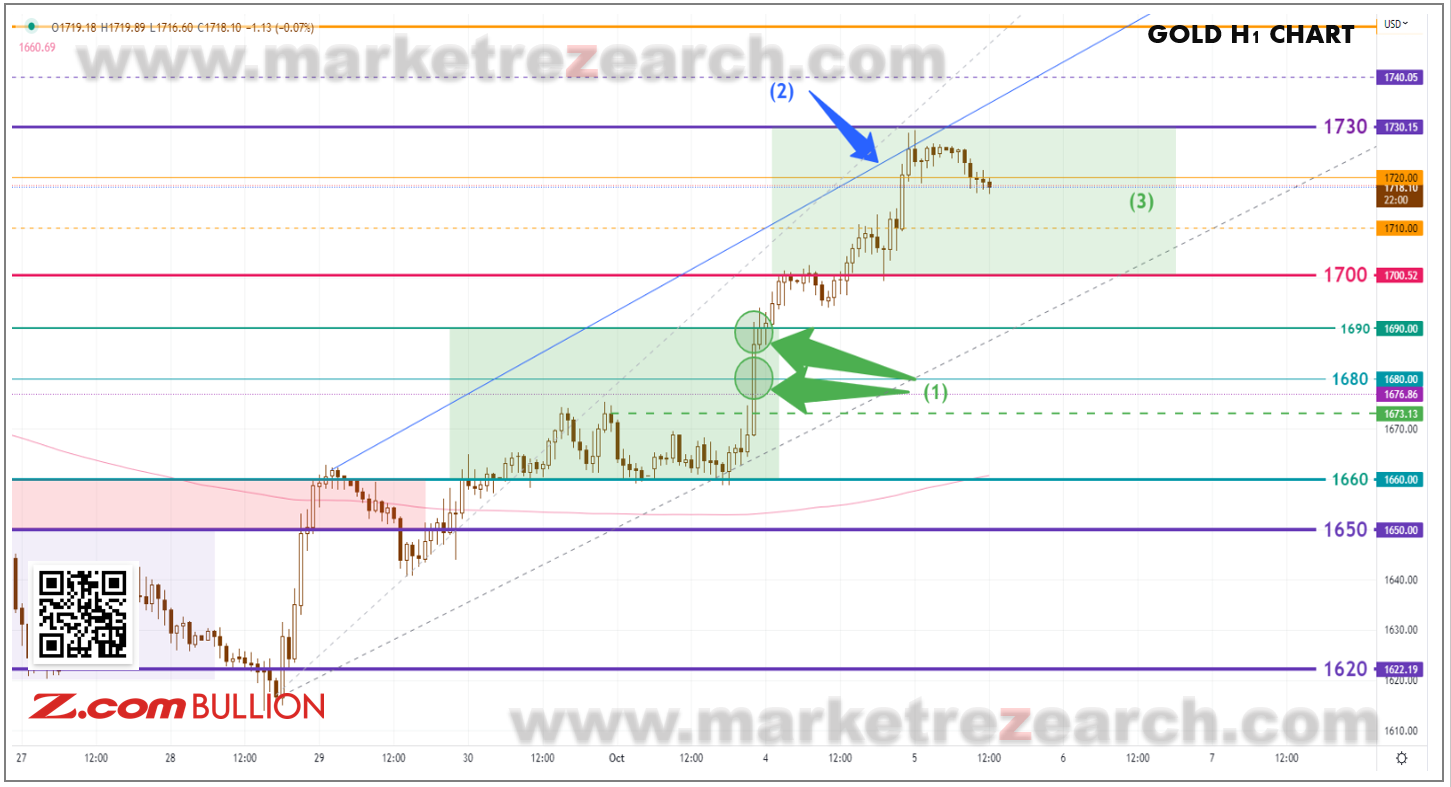
Gold renewed the 3-weeks high yesterday. Carried the buying momentum from the day before, a new round of buying was triggered after the price cleared the resistance at 1700 early in the Asian session. The bullish trend continued until it touched the day-high near 1729 late in the US session. The day ended at 1725, up by USD 25.
After all the interventions and the news from the BOJ & the BOE, gold is trading above the critical support of 1680(1) again. The S-T trendline(2) can be used as a resistance reference for the current bullish trend. While the market is now shifting its focus to the US employment figures this Friday unless the price can clear the resistance at 1730, expect the price to remain in 1700-30 in the next 48 hours.
Since gold escaped the downtrend channel (4) and broke out from the 20 days MA, a bullish trend has begun on the daily chart. Unless the price can clear the 50-day MA and trigger a new round of buying, 1700-30 should be the range for today.
S-T Resistances:
1730
1725
1720
Market price: 1718
S-T Supports:
1710
1705
1700
Risk Disclosure: Gold Bullion/Silver (“Bullion”) trading carries a high degree of risk, and may not be suitable for all investors. The high degree of leverage can work against you as well as for you. This article is for reference only and is not a solicitation or advice to trade any currencies and investment products . Before deciding to trade Bullion you should carefully consider your investment objectives, level of experience, and risk appetite. The possibility exists that you could sustain a loss of some or all of your initial investment or even more in extreme circumstances (such as Gapping underlying markets) and therefore, you should not invest money that you cannot afford to lose. You should be aware of all the risks associated with trading Bullion, and seek advice from an independent financial advisor if you require. Client should not make investment decision solely based on the point of view and information on this article.
2022-10-05 @ 11:42
黃金昨日再試1週高位。受消息帶動,黃金前日已回到1680關鍵支持之上。昨日早段承接前日收市前升勢,在亞盤突破前日高位1700後觸發新一輪買盤,價格一直上漲至收市前高位1729。全日收市在1725,上升25美元。 1小時圖 – 黃金自前日突破1680-90(1)阻力區之後,交易區間已經上移。上升阻力可參考趨勢線(2)。市場正將焦點轉移到週五的美就業數據,日內初步可以1700-30(3)為操作區間。 日線圖 – 黃金在週一升穿下降通道(4)及20天移動平均線後觸發一輪買盤,價格一直上漲到50天移動平均線(5)。日內除非金價能突破1730再觸發新一輪買盤,否則未來48小時金價將會在1700-30區間內震蕩。 短線阻力: 1730 1725 1720 現價:1718 短線支持: 1710 1705 1700 風險提示: 場外式黃金/白銀交易涉及高度風險,未必適合所有投資者。高度的槓桿可為閣下帶來負面或正面的影響。閣下在決定買賣場外式黃金/白銀之前應審慎考慮自己的投資目標、交易經驗以及風險接受程度。可能出現的情況包括蒙受部分或全部初始投資額的損失,或在極端情況下(例如相關市場跳空)產生更多的損失。因此,閣下不應將無法承受損失的資金用於投資。投資應知悉買賣場外式黃金/白銀有關的一切風險,如有需要,請向獨立財務顧問尋求意見。市場資料僅供參考,Z.com Bullion 絕不保証分析內容的準確性。