2026-02-17 @ 13:01
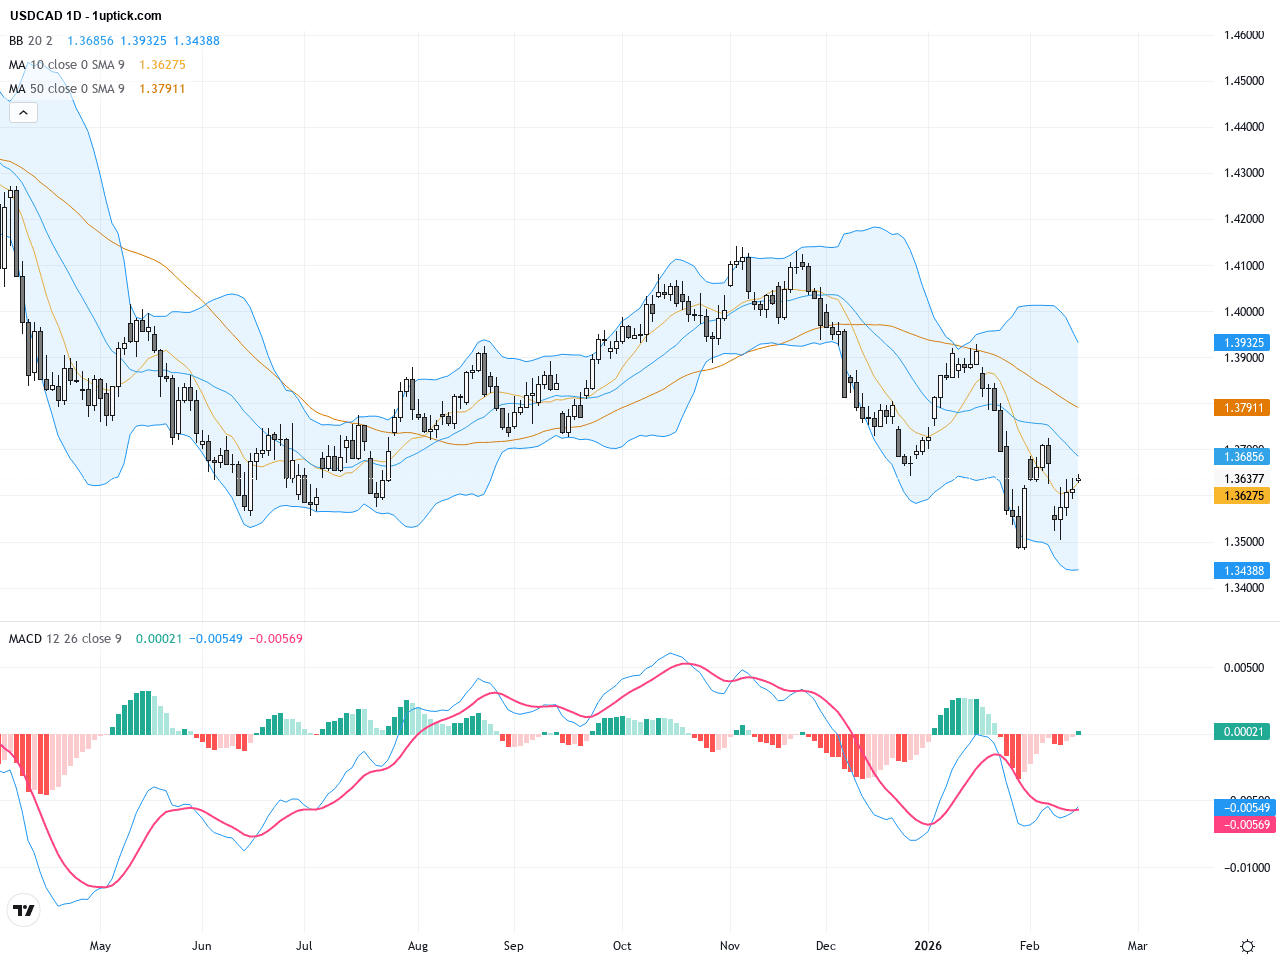
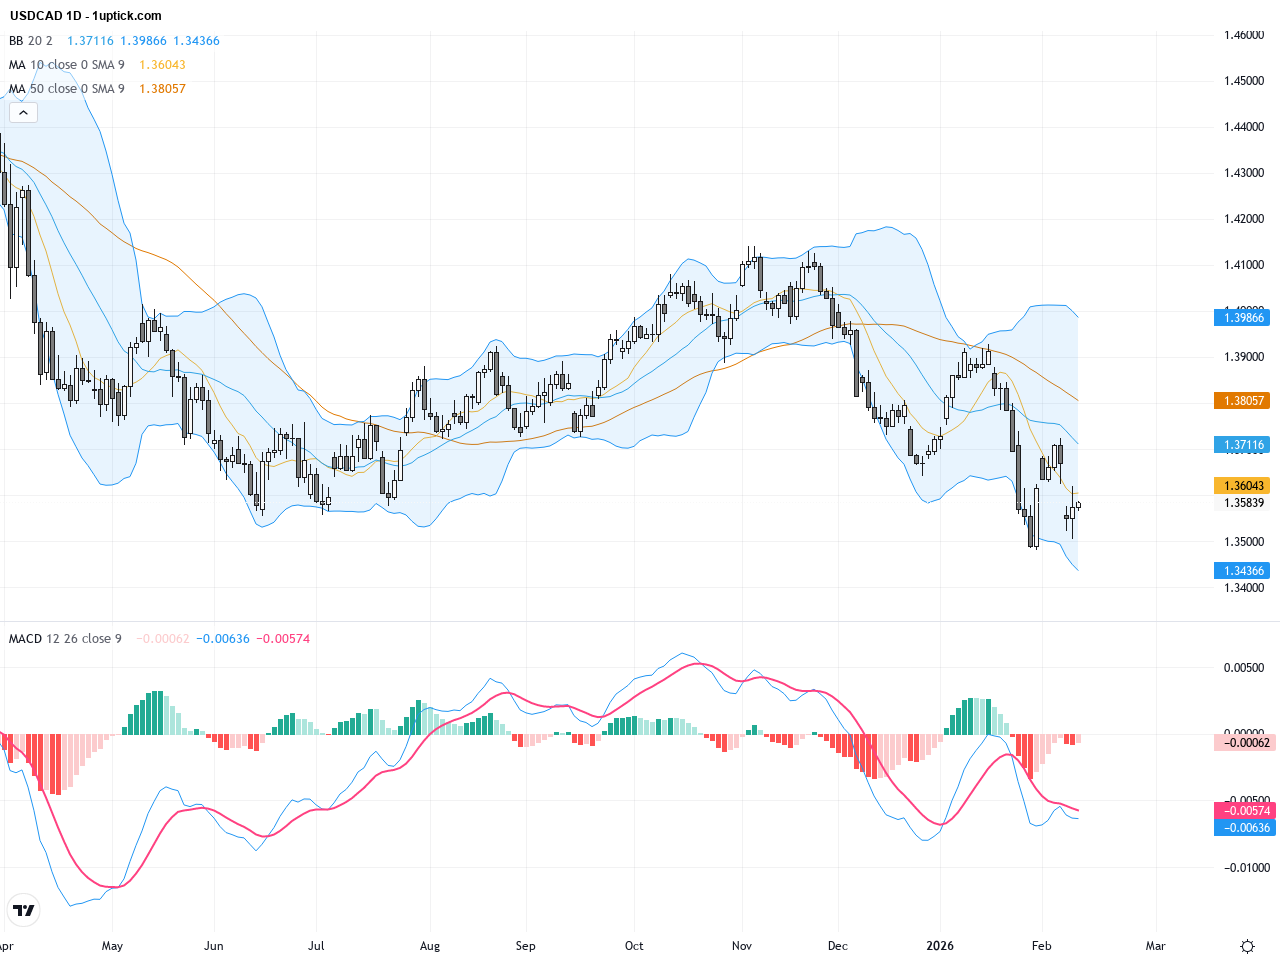
近期USDCAD於過去三個交易日展現出波動加劇的態勢,昨日收盤價為1.36374。美國美元整體走強及支撐位1.3500的堅韌表現成為市場主要推力。多重消息顯示,美元指數與美元相關貨幣對均呈現持續的市場焦點,使投資者信心增強。特別是在美國經濟數據與油價波動的影響下,USDCAD價格在1.3550至1.3700之間波動,形成短線明顯的支撐與阻力。對於一般投資人來說,這代表在美元走強背景下,USDCAD存在良好上漲潛力,但同時需注意油價及加拿大經濟指標帶來的調整風險。
2026-02-17 @ 06:01
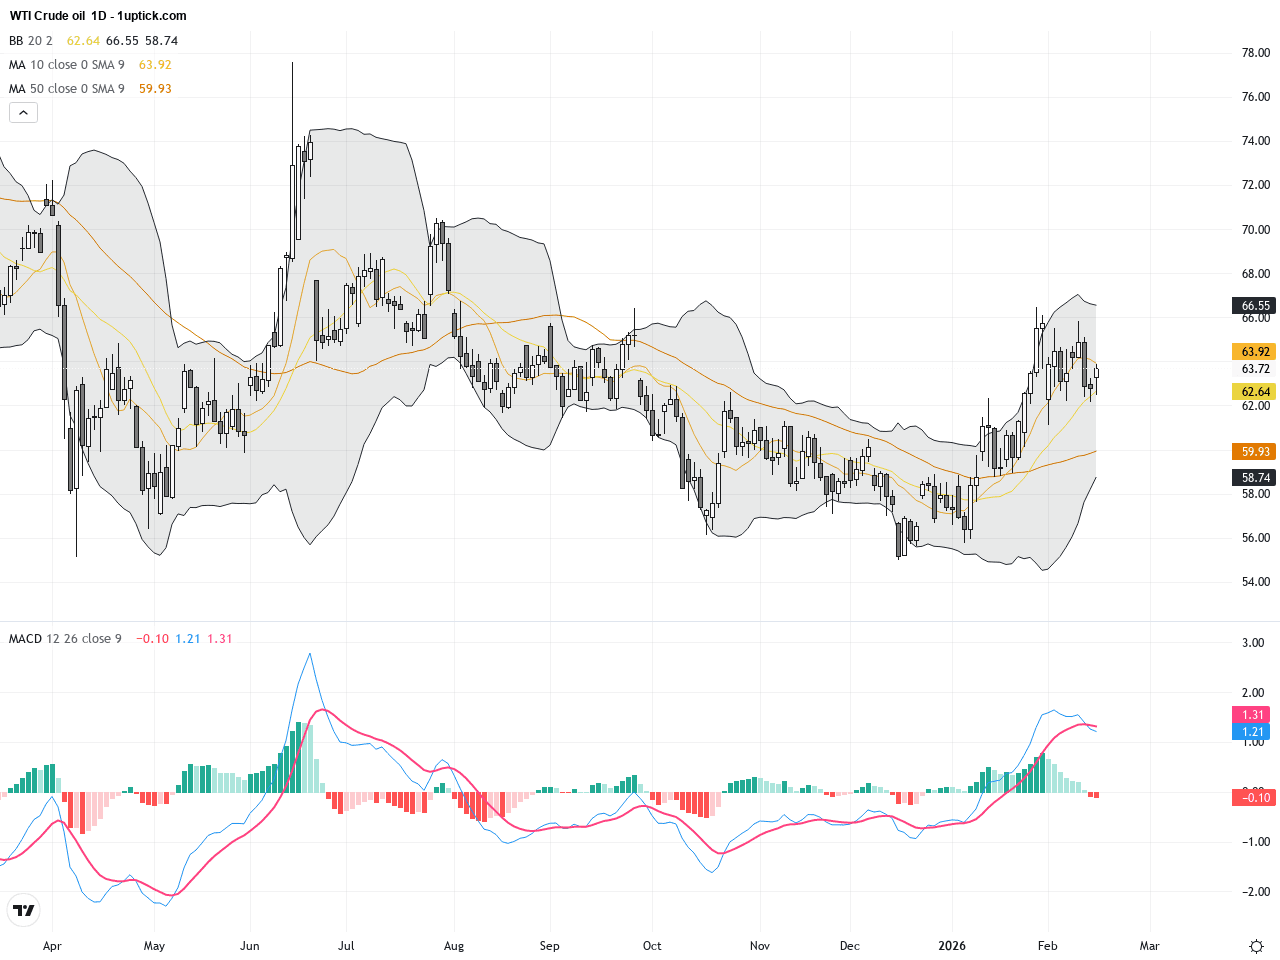
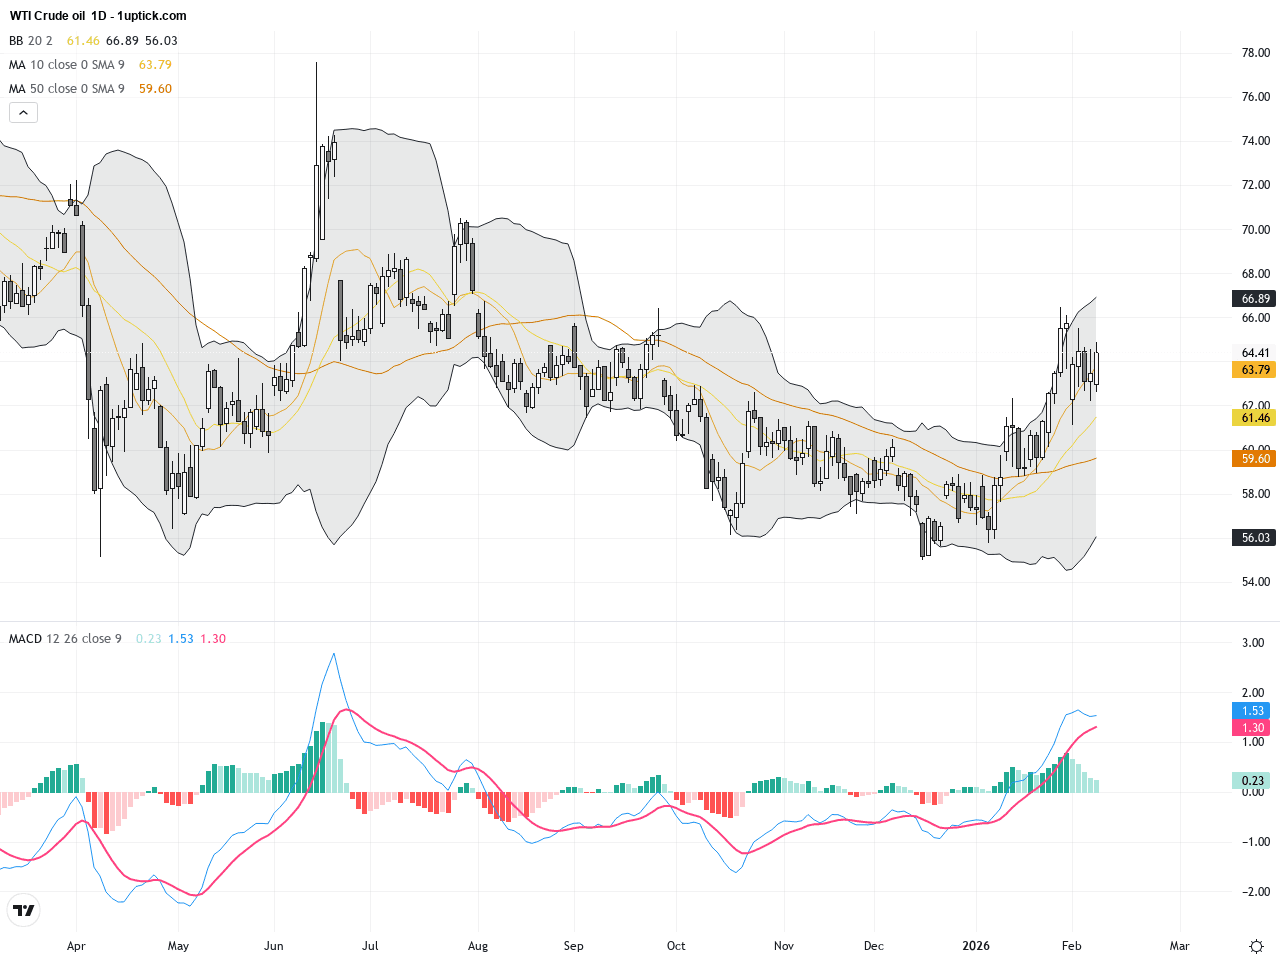
在過去24至48小時內,WTI原油價格保持在63美元附近盤整,延續了近期的相對穩定趨勢。以2月16日收盤價63.56美元作為基準,油價未出現大幅波動,但市場卻充滿了諸多驅動因素,引起投資者高度關注。 此次油價波動的核心動力來自即將於華盛頓和德黑蘭之間展開的關鍵談判。投資者密切關注這場對美伊關係有深遠影響的會談,因其可能改變全球供應格局及風險溢價。與此同時,美國最新的就業數據修訂以及通脹信號亦對需求預期產生壓力,令市場在需求面和地緣政治風險間保持謹慎。 另外,石油股尤其是能源板塊ETF(XLE)今年迄今大漲21.6%,反映投資者在油價約64美元的現實中漸漸適應,並押注石油巨頭將有效駕馭當前市場環境。儘管投機多頭情緒有所收斂,但整體供需平衡依然穩固,支撐油價的關鍵防線。 簡而言之,對一般投資者而言,這段時間WTI油價平穩反映了市場在不確定的地緣政治背景和多變的經濟數據下,仍能維持相對穩健的供需結構。短期內,談判結果及美國經濟數據的持續反饋將是影響油價走勢的關鍵。對於油市投資者來說,密切關注這些事件有助於做出更為明智的交易決策。 日線圖 1小時圖 整體趨勢: 阻力&支持 上方阻力 下方支持 68.00 62.30 66.50 61.00 65.00 59.50 以上金融市場數據、報價、圖表、統計數據、匯率、新聞、研究、分析、購買或者出售評分、財金教學及其他資訊僅作參考使用。在根據資訊執行任何交易前,應諮詢獨立專業意見,以核實定價資料或獲取更詳細的市場信息。1uptick.com 不應被視為游說任何訂戶或訪客執行任何交易,閣下須為自己的所有交易負責。
2026-02-16 @ 09:01
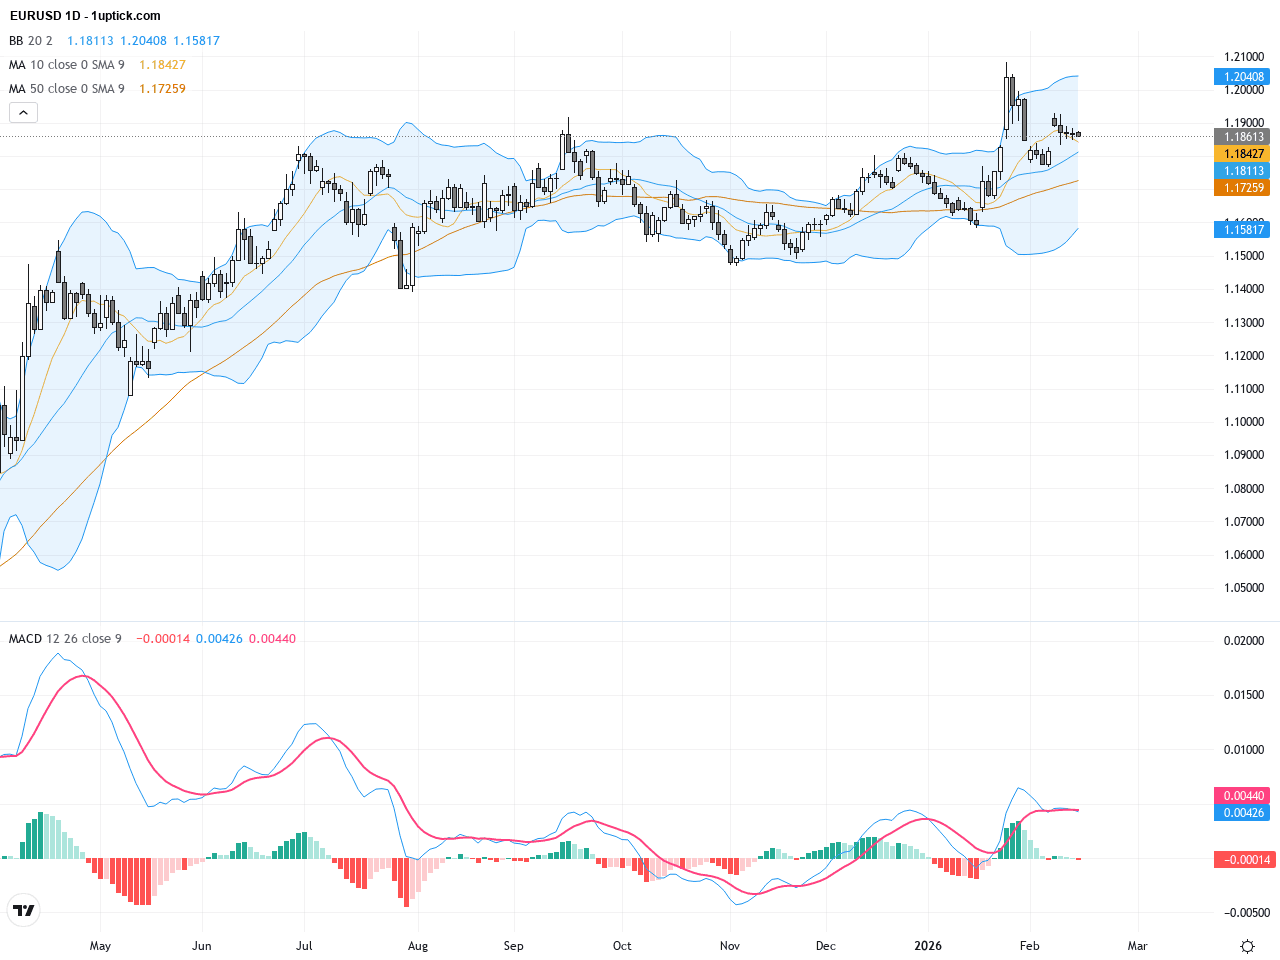
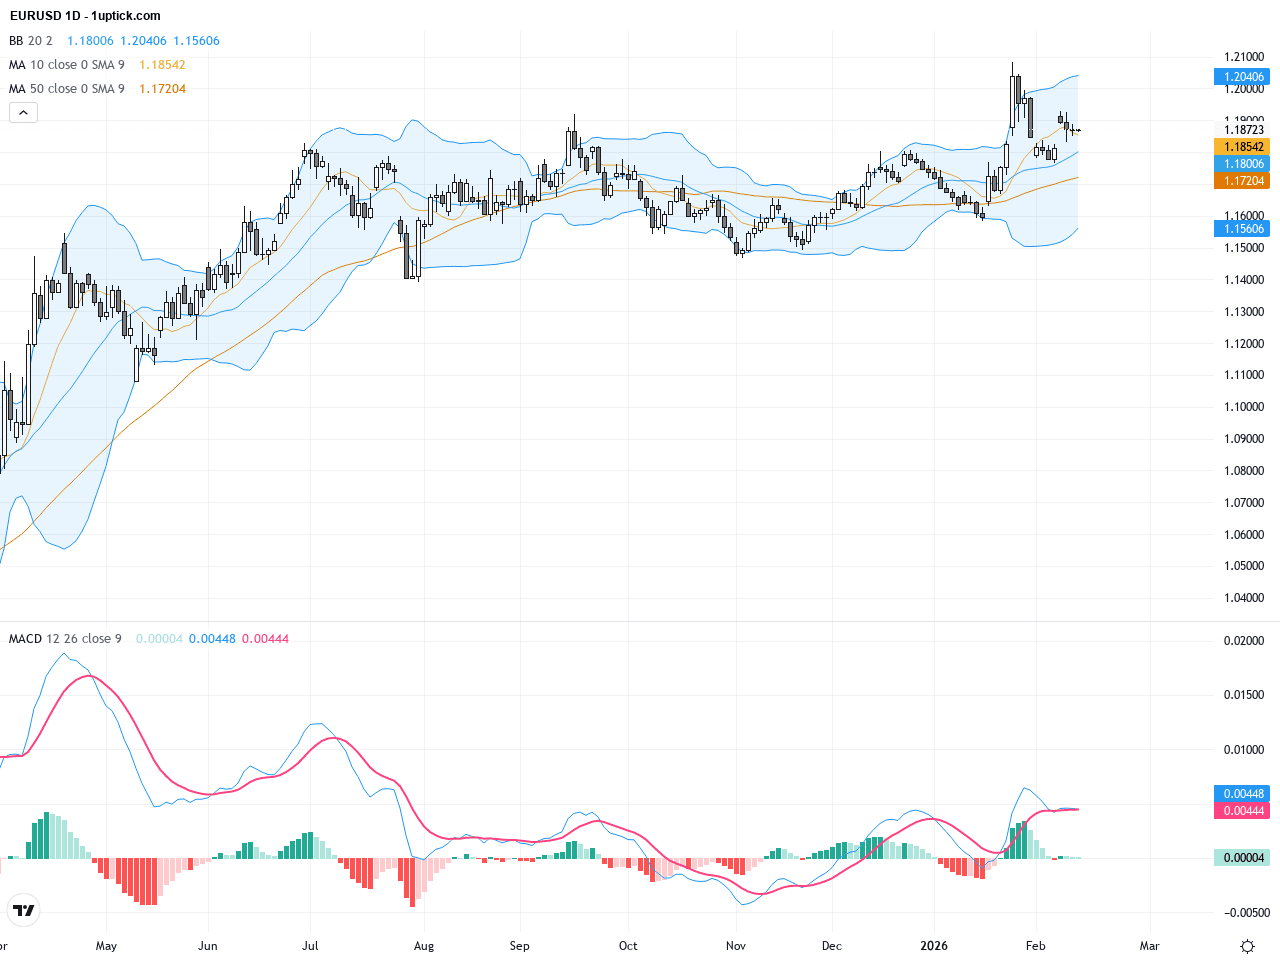
近期EURUSD展現穩健上漲趨勢,過去三個交易日波動集中於1.1840至1.1890區間,昨日收於1.18612,微跌0.055%,反映市場多空力量的微妙調整。受到市場對歐元區經濟數據及美國CPI數據符合預期的雙重支持,帶來相對穩定的美元和歐元表現。多家機構預期EURUSD將會突破1.20心理關卡,顯示基本面利好為未來升勢鋪路。對於散戶而言,這意味著近期或呈現小幅整理以消化漲勢,待趨勢再度確立後,投資者可尋求因勢入市的短多機會。
2026-02-13 @ 11:01
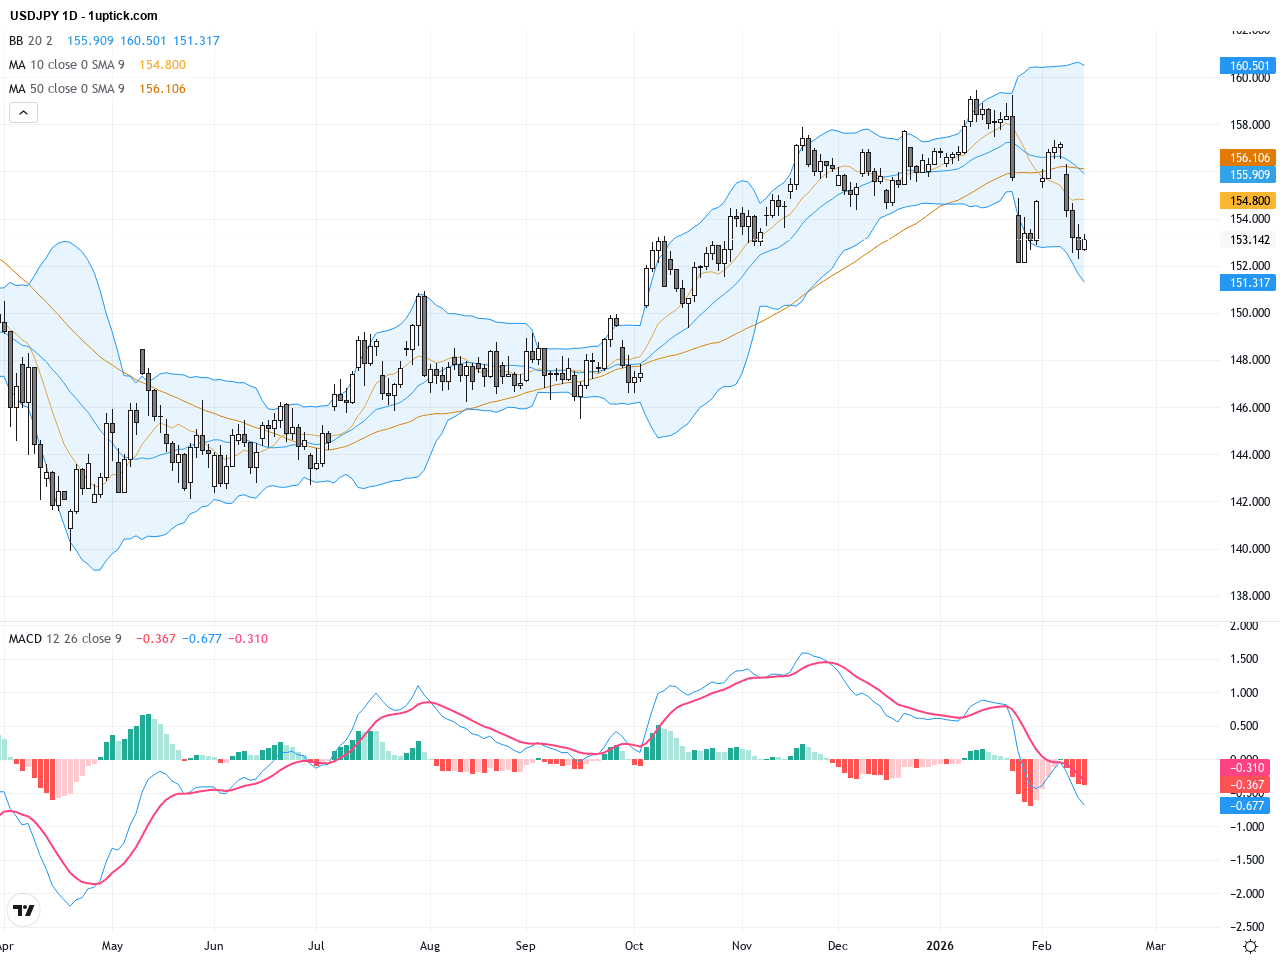
過去三個交易日,USDJPY在153關口附近劇烈震盪,昨日收盤於153.156。市場受日本央行升息預期與即將公布的美國CPI數據影響,短線情緒偏向謹慎。日本央行加息押注與美日利差收窄令日圓升值壓力加大,美日貨幣對盤整態勢濃厚。對普通投資人來說,這意味著USDJPY波動加劇,適合注重風險管理的交易策略。本周市場新聞揭示日圓因潛在政策干預及美國經濟數據不確定性而成為焦點,短期內價格走勢受消息面牽動明顯。
2026-02-13 @ 09:01
過去三個交易日,EURUSD走勢穩定,價格圍繞1.1870上下震盪,昨日收盤於1.18722。美元指數受美國初請失業金人數超出預期影響出現回落,促使歐元兑美元回升並終結兩日跌勢。市場持續關注即將公布的歐元區GDP與美國消費者物價指數(CPI),這兩項關鍵指標將直接左右EURUSD中短期的價格走向。對一般投資人而言,這意味著匯率仍處於觀望期,需密切關注數據結果以判斷未來走勢方向。
2026-02-12 @ 13:01
USDCAD在過去三個交易日展現溫和上揚趨勢,昨日收盤於1.3583。近期強勁的美國非農就業報告推動美元升值,同時抑制了加拿大元的表現,讓USD/CAD在亞洲時段輕微走高至1.3580左右。美國良好的就業數據不僅減少市場對聯儲降息的預期,還加劇了美元的市場吸引力。這一系列消息驅動了市場情緒,使交易者更加看好美元,對USDCAD的交易觀點轉向偏多。對於普通投資者而言,這代表外匯市場上的美元兌加幣匯價因美國經濟數據利好而走強,短期內匯率可能會維持在相對高位置波動。
2026-02-11 @ 13:01
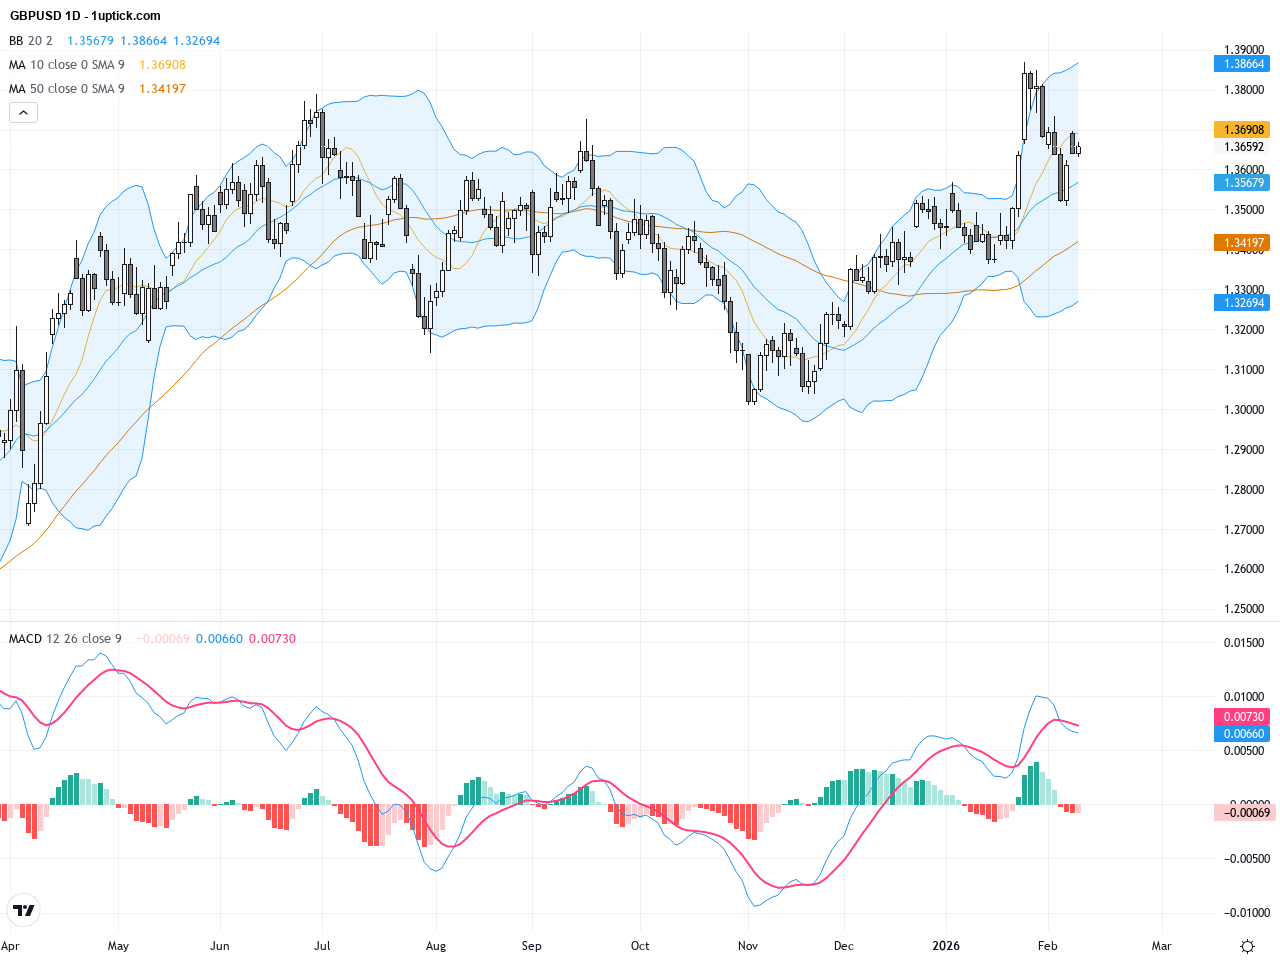
過去三個交易日內,GBPUSD呈現顯著波動。英鎊昨日收於1.36592,較前日晚盤小幅回升。美國零售銷售數據不及預期,與中國官方要求減持美債消息同步發酵,導致美元大幅回撤,從而推動英鎊兌美元的強勢反彈並突破1.38關口。市場情緒因美元疲弱而轉向英鎊,看似迎來短線買盤加碼。投資者應把握此波波動性機會,同時留意即將發佈的美國非農就業數據,因其將對GBPUSD價格動向形成重要催化劑。整體來看,本周市場動能由美元疲態主導,影響英鎊價格走勢。
2026-02-10 @ 13:01
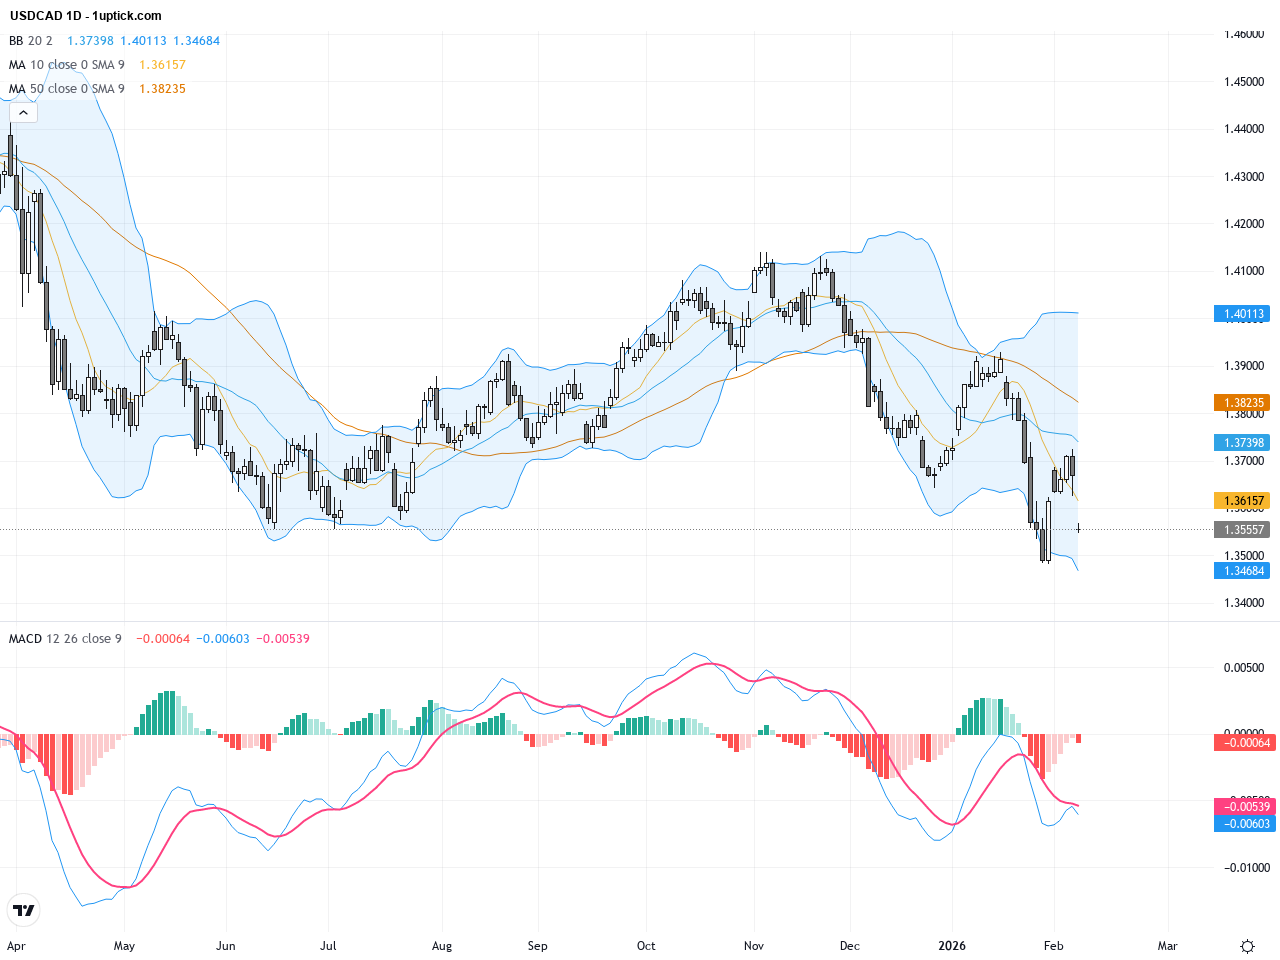
過去三個交易日,USDCAD價格在美元疲軟和加元資金流入的雙重影響下呈現震盪走低態勢,昨日收於1.35557,接近近期支撐區域。中國減少美國國債的消息進一步打壓美元,加劇了市場對美元下行的擔憂,同時油價上漲對加元形成支撐。對於普通投資者而言,這意味著美元相對加元短期壓力加大,可能迎來波動加劇。整體看,本周市場情緒偏向加元,後市需關注美國核心經濟數據以判斷美元反彈可能性。
2026-02-10 @ 06:01
在過去24至48小時內,WTI原油價格呈現波動上升趨勢,昨收盤價為64.42美元。市場在美國與伊朗地緣政治緊張局勢的擔憂持續下,油價獲得進一步支撐。儘管美伊雙方同意於阿曼展開間接會談,降低軍事衝突風險,但市場仍謹慎觀望,這種懸而未決的情勢維持了油價的上行空間。 同時,紐約商品交易所數據顯示汽油及原油期貨價格普遍走高,反映出需求穩健,而蒸餾油期貨價格則有所回落。印度開始減少從俄羅斯的石油購買,為油價提供了支撐底部。此外,儘管地緣政治風險有所緩解,供應擔憂仍未完全消退,令WTI原油價格維持在約63至65美元範圍內波動。 對普通投資者而言,這段時間WTI原油價格的變化就像是在平衡一場複雜的天秤:一方面是美伊談判讓市場稍感安心,抑制價格的急跌;另一方面,供應中斷的潛在風險和全球需求持續增長讓油價保持企穩甚至小幅上揚。投資者在這種環境下,需要關注國際政治動態及市場供需變化對油價的影響,做好風險管理。 日線圖 1小時圖 整體趨勢: 阻力&支持 上方阻力 下方支持 66.10 63.00 65.50 62.20 64.80 61.40 以上金融市場數據、報價、圖表、統計數據、匯率、新聞、研究、分析、購買或者出售評分、財金教學及其他資訊僅作參考使用。在根據資訊執行任何交易前,應諮詢獨立專業意見,以核實定價資料或獲取更詳細的市場信息。1uptick.com 不應被視為游說任何訂戶或訪客執行任何交易,閣下須為自己的所有交易負責。
2026-02-09 @ 13:01
過去三個交易日內,GBPUSD匯價自年初高點1.3876持續下跌,昨日收盤於1.36045,呈現小幅回調趨勢。近期市場情緒受美元穩定及英國經濟數據影響,特別是美國ISM服務業PMI強勁,推升美元動能,壓制英鎊。此波價格調整正反映市場對英鎊未來走勢的謹慎態度。對普通投資者而言,目前形勢類似運動賽中短暫喘息,等待下一波更明確趨勢指引。整體GBPUSD仍在1.35附近尋找強支撐,短線將聚焦於關鍵技術水平及即將公布的歐洲央行主席講話,任何催化消息均可能引發價格加速。