Nvidia ready for a new all time high?
2025-01-08 @ 06:46

Price Movement
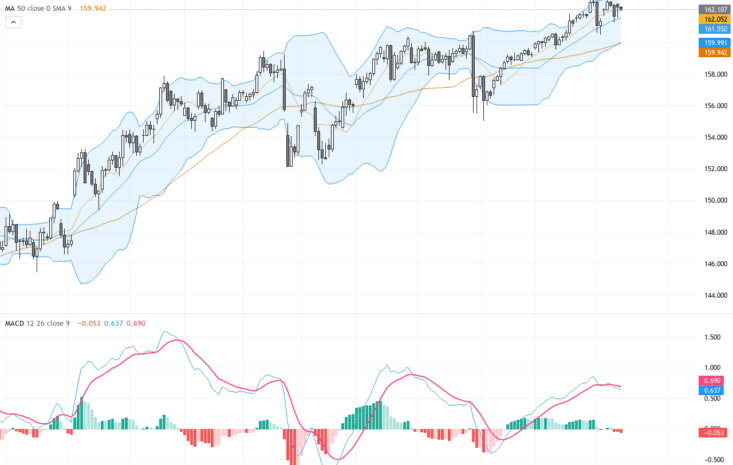
The Nasdaq daily candlestick chart showcases a notable upward trajectory over the past year. Initially, prices were in a strong bullish trend, evident by the sequence of higher highs and higher lows. This rally peaked during mid-year, where the asset reached a significant resistance level at around 153. This was followed by a period of consolidation, characterized by lateral price movements. More recently, there has been another bullish breakout attempt, as seen by the long upward candlesticks penetrating the previous resistance. The price currently sits just above the 140 level. The emergence of larger candlesticks indicates increased volatility and potential bullish sentiment, although the recent drop of about 6.22% shows bearish pressure might still be significant.
Technical Analysis
| Technical Pattern/Indicator | Analysis |
|---|---|
| Bullish Channel | The price is moving within a rising channel, indicating a continued uptrend as long as prices stay within its bounds. |
| MACD Crossovers | The MACD line recently crossed above the signal line, suggesting renewed bullish momentum. |
| Simple Moving Averages (SMA) | The price is currently around the 50-day SMA, serving as a dynamic support level, while staying above the 100-day and 200-day SMAs, supporting a long-term uptrend. |
Outlook
The current outlook for the Nasdaq remains cautiously optimistic amidst recent bullish movements. The MACD’s bullish crossover hints at a potential continuation of the upward trend, while the upward channel suggests that higher indices could be anticipated as long as the price respects its boundaries. However, the recent sharp decline of 6.22% highlights potential bearish pressure that traders should watch carefully. If prices dip below the current support and moving averages, a re-evaluation of market sentiment might be necessary.
Support and Resistance
| Support Levels | Resistance Levels |
|---|---|
| 135.00 | 145.00 |
| 130.00 | 150.00 |
| 125.00 | 153.00 |