Dow turns sideway ?
2025-01-07 @ 12:46

Price Movement
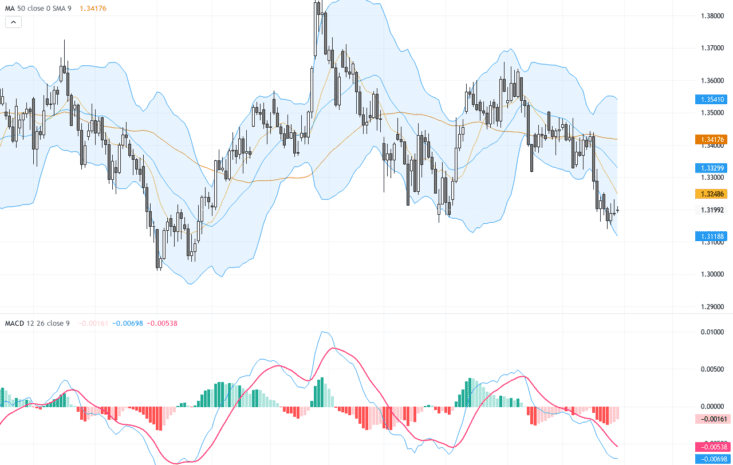
The Dow’s daily chart shows a period of consolidation within a defined upward channel. The asset recently experienced a pullback from its highs near 45,000, correcting to the lower boundary of the channel. The price now hovers around the 42,969 mark. The candlestick patterns suggest minor indecision, reflecting in the recent shadows both above and below the body. Short-term moving averages exhibit a converging pattern, hinting at potential for a directional change. The past few sessions indicate a test of key support, which, if held, might bolster a rebound toward the upper channel limits.
Technical Analysis
- Upward Channel: Defined by green trend lines, suggesting a bullish tendency.
- Moving Averages (SMA):
- SMA 42,908, 43,148, 43,449, 43,643, 42,816 showing convergence may indicate potential reversal or continuation.
- MACD: Currently exhibiting bearish momentum but showing signs of bottoming out.
- Support Zone: 42,485 – 43,750 as marked in the red area, a crucial support band.
Potential Trend and Movement
- If the support holds, expect a bounce back toward 44,000-45,000.
- A break below could lead to further testing lower levels, around 42,000.
Outlook
The outlook for the Dow appears cautiously optimistic within a longer-term bullish channel. The convergence of the moving averages suggests a potential breakout situation in either direction. However, the critical test will be the support levels near 42,485. Should these hold, the asset could see resurgence back to recent highs. Conversely, breaching these supports might lead to a deeper correction, pointing to a cautious approach for traders. Given the mixed signals from technical indicators, it is essential to monitor upcoming price actions closely to confirm any directional bias.
Support and Resistance
| Support | Resistance |
|---|---|
| 42,485 | 43,500 |
| 42,000 | 44,000 |
| 41,500 | 45,000 |