CBOT Corn broke out from resistance!
2025-01-20 @ 11:16

Price Movement
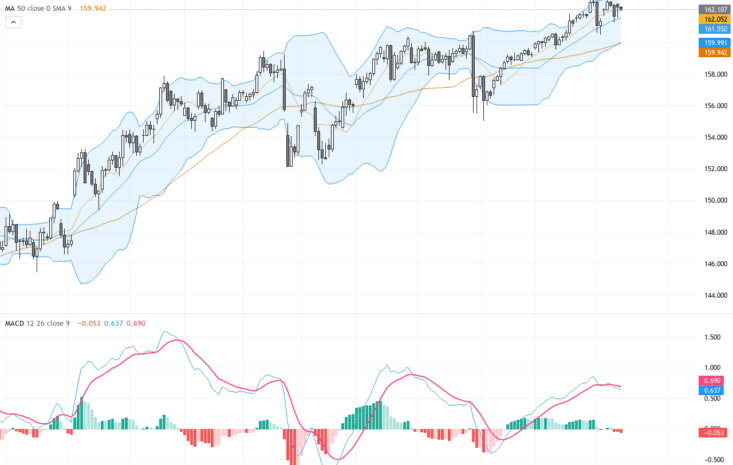
The daily candlestick chart shows a significant upward trend in recent months. Initially, there was a bearish movement characterized by a series of lower highs and lower lows. However, this trend reversed as the asset formed a noticeable bottom pattern, followed by a strong recovery. The price has been consistently climbing, breaking through multiple resistance levels, and is currently consolidating above a previous high around 4842. This positive momentum is supported by the alignment of the moving averages, suggesting a robust bullish sentiment. The price action has shown a series of higher highs and higher lows, indicating strong buyer interest. The asset’s price is navigating through an ascending channel, maintaining a position near the upper boundary. This suggests that any corrections could be seen as pullbacks within an overall continuation of the upward trend.
Technical Analysis
| Technical Pattern/Indicator | Analysis |
|---|---|
| Ascending Channel | The price is within an ascending channel, indicating a continuation of the upward trend. Breakouts could lead to further gains. |
| Moving Averages (50, 100, 200 SMA) | The alignment of the SMAs in an upward direction confirms the bullish trend. Price trading above these averages suggests strong support. |
| MACD | MACD line is above the signal line, indicating upward momentum. The histogram is positive, supporting bullish conditions. |
| Support/Resistance Levels | The price has recently tested and traded above a key resistance level of 4726. Successful hold above this level turns it into support. |
Outlook
The current outlook for the asset is positive, with strong indications of a sustained upward trend supported by several technical factors. The ascending channel suggests that the price movement will continue along its path, with potential for further upside. The alignment of moving averages highlights ongoing bullish momentum, while the MACD confirms sustained buying interest. Barring any significant negative catalysts, the asset is poised to capitalize on its current trend, with bullish signals remaining dominant. Monitoring changes in momentum indicators and channel boundaries is crucial for assessing any potential reversal signs.
Support and Resistance
| Type | Price |
|---|---|
| Support | 4726 |
| Support | 4500 |
| Support | 4300 |
| Resistance | 4900 |
| Resistance | 5000 |
| Resistance | 5050 |