AUDUSD bottom out ?
2025-01-07 @ 10:59
Price Movement
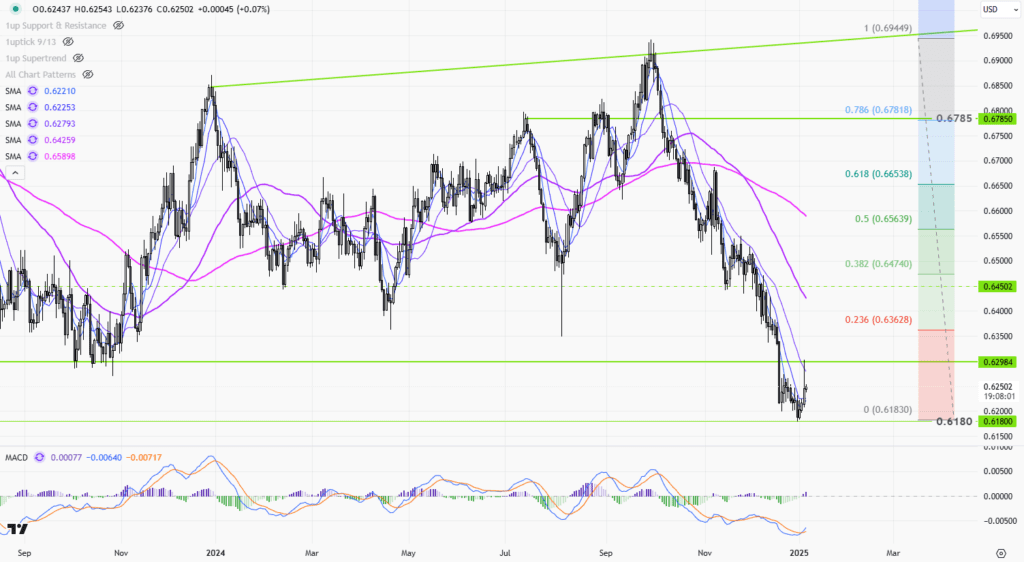
The AUD/USD daily chart depicts a consistent downtrend over recent months, with the price moving from above 0.6800 to below 0.6300. The decline appears accelerated during the latter phases, where the price fell sharply, suggesting increased bearish momentum. The pair has recently displayed signs of stabilization around the 0.6180 level, which aligns with the significant Fibonacci retracement level. The recent candlestick formations indicate potential indecision in the market, as prices attempt to find a stable support. However, the overall sentiment remains bearish unless there is a solid breakthrough of identified resistance levels.
Technical Analysis
- Moving Averages: The chart displays a bearish alignment with shorter-term moving averages below the longer-term ones, confirming the downtrend.
- Fibonacci Retracement: Key levels at 23.6% (0.63628), 38.2% (0.64740), and 50% (0.65639) suggest potential resistance points.
- MACD: The MACD line is below the signal line, indicating persistent selling pressure.
- Chart Pattern: Potential double bottom formation near 0.6180 could indicate a reversal if confirmed by future price action.
Outlook
The current outlook for AUD/USD remains cautiously bearish. Short-term stabilization near the 0.6180 level may provide temporary relief, but significant resistance levels overhead require a bullish breakout for a trend reversal. The MACD supports continued downward momentum, adding risk to bullish positions. Traders should closely monitor key support levels for stability signs or any bullish reversal patterns. Until a confirmed break above 0.6450, market sentiment is likely to favor further downside pressure.
Support and Resistance
| Support Levels | Resistance Levels |
|---|---|
| 0.6180 | 0.63628 |
| 0.62984 | 0.64740 |
| 0.64502 | 0.65639 |