AUDUSD bottom out ?
2025-01-07 @ 11:16

Price Movement
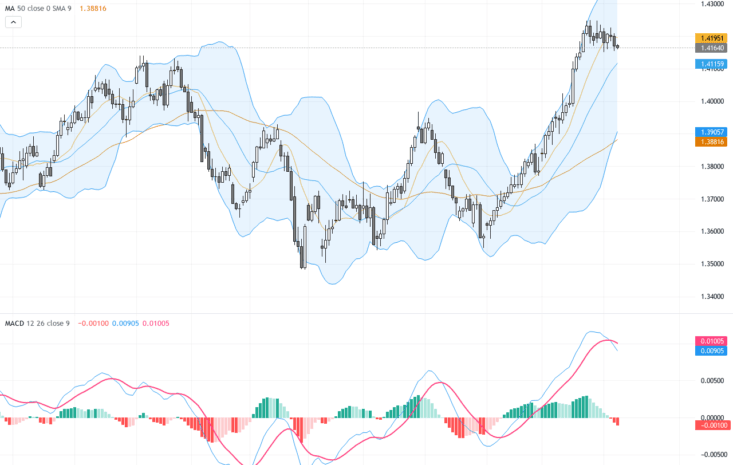
The AUD/USD daily chart indicates a downward trend over the observed period. Initially, the pair exhibited a series of lower highs and lower lows, indicative of sustained selling pressure. The price recently reached a significant low around 0.6180 before experiencing a minor rebound. This corrective bounce is visible against a backdrop of ongoing bearish momentum. The emergence of smaller candlesticks near current price levels suggests potential consolidation. Despite the recent upward movement, the pair remains under the influence of a broader bearish trend. Recent candlesticks near support levels hint at possible stabilization, though a definitive reversal pattern is not yet apparent.
Technical Analysis
- Moving Averages: The AUD/USD is trading below its 50-day and 200-day simple moving averages (SMAs), reinforcing the bearish outlook.
- Fibonacci Retracement: The price is testing the 23.6% retracement level at 0.63628, offering potential resistance.
- Support Trendline: Recent price action respects an established support trendline near 0.6180.
- MACD: The MACD lines have recently converged, potentially signaling a waning bearish momentum, indicating that a stronger correction could ensue if a bullish crossover occurs.
Outlook
The current outlook for AUD/USD remains cautious, as the pair is in a downtrend though showing signs of short-term correction. The price is probing key resistance levels, and while there is potential for further corrective movements, the downtrend remains intact unless a significant break above major resistance levels occurs. Traders should watch for bullish signals, such as a MACD crossover or a break above the moving averages, to confirm any potential shift in momentum. For now, the pair might oscillate within a defined range, testing support and resistance levels.
Support and Resistance
| Support Levels | Resistance Levels |
|---|---|
| 0.6180 | 0.64502 |
| 0.62984 | 0.65639 |
| 0.63628 | 0.67850 |