


 |
 |
| Gold V.1.3.1 signal Telegram Channel (English) | 黃金交易訊號 V.1.3.1 Telegram 群組 (中文) |

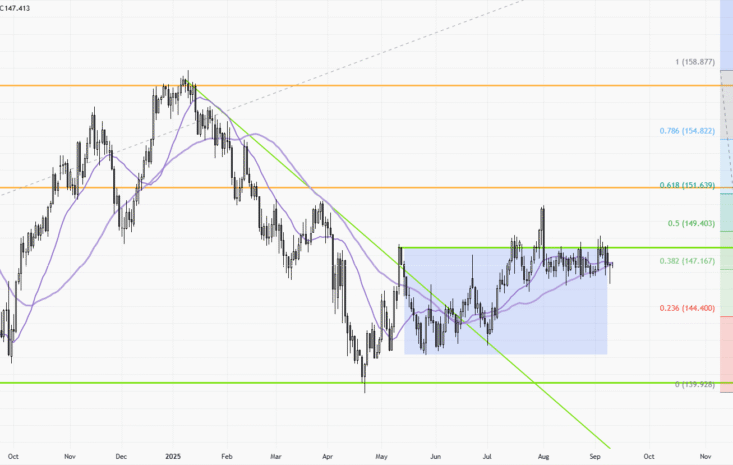
USDJPY uptrend remains?
2024-12-30 @ 09:50
Price Movement
The USD/JPY daily chart displays a strong upward trend, with the price moving consistently higher since early October. After hitting a low around 140 in late August, the pair embarked on a bullish trajectory, breaking multiple resistance levels. Recently, the pair has consolidated just below a significant resistance at 160, indicating a pause in the upward momentum as traders assess the next direction. A clear ascending channel has formed, highlighting the persistent buying interest. The 50-day and 100-day moving averages are both sloping upwards, reinforcing the overall bullish sentiment in the market.
Technical Analysis
- Moving Averages: The 50-day SMA is above the 100-day SMA, confirming the bullish bias.
- Trendline: A strong upward trendline supports the current bullish move.
- MACD: The MACD line is above the signal line, suggesting continued upward momentum.
- Resistance Zone: Price near a psychological resistance around 160, which has previously triggered selling pressure.
- Volume: Increasing volume on rally days supports the strength of the current bullish trend.
Outlook
The outlook for USD/JPY remains bullish, given the current technical indicators and the persistent upward trend. However, the proximity to the significant resistance at 160 suggests caution, as this level has historically triggered reversals. A sustained break above 160 could signal further gains, potentially targeting new highs. Conversely, a rejection at this level could lead to a retracement towards the support at 156. Traders should monitor the price action closely, particularly around key levels, to better gauge the pair’s future direction. A consolidation phase might also occur, allowing the pair to gather strength for a potential breakout.
Support and Resistance
| Support Prices | Resistance Prices |
|---|---|
| 153.50 | 160.00 |
| 150.00 | 162.00 |
| 148.00 | 164.00 |