EUR find the botton yet?
2024-12-28 @ 21:05

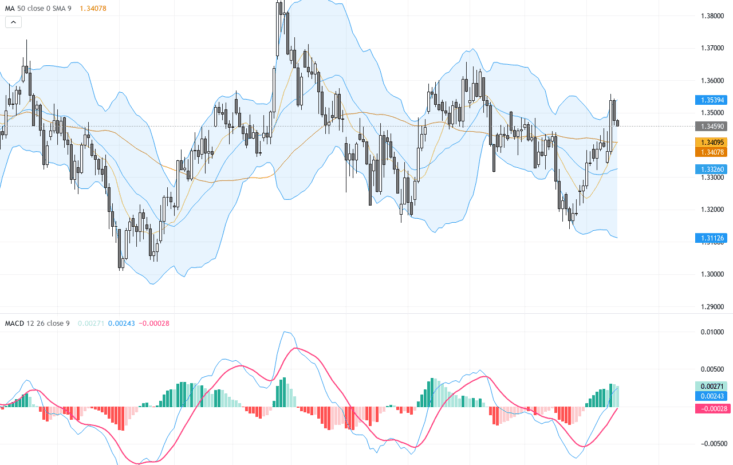
Price Movement
The EUR/USD daily chart showcases a significant downtrend over recent months, with the pair forming lower highs and lows. After a sharp decline in late October, the price began to stabilize, finding support around the 1.0333 level. This support held multiple retests, indicating a temporary halt in the bearish momentum. Meanwhile, the pair also faced strong resistance at the 1.0465 level, creating a confined trading range. The price is currently hovering around this resistance level, suggesting potential consolidation or a reversal pattern might be forming. Moving averages positioned above the price denote ongoing bearish sentiment.
Technical Analysis
Outlook
The current outlook for EUR/USD remains cautiously bearish with signs of potential consolidation. The stabilization around the support level of 1.0333 suggests a possible base building, but the inability to break above 1.0465 keeps the pair in a confined range. A breakout above this resistance could signal a short-term reversal and target higher Fibonacci levels, particularly around 1.0541. However, continued rejection at resistance may lead to further declines, retesting the support at 1.0333. Monitoring the moving averages and MACD alignment will provide further insights into the strength of any price movement. Investors should remain vigilant for a decisive breakout from this range for clearer trend direction.