CAD at 4 years low! What’s next?
2024-12-30 @ 12:50

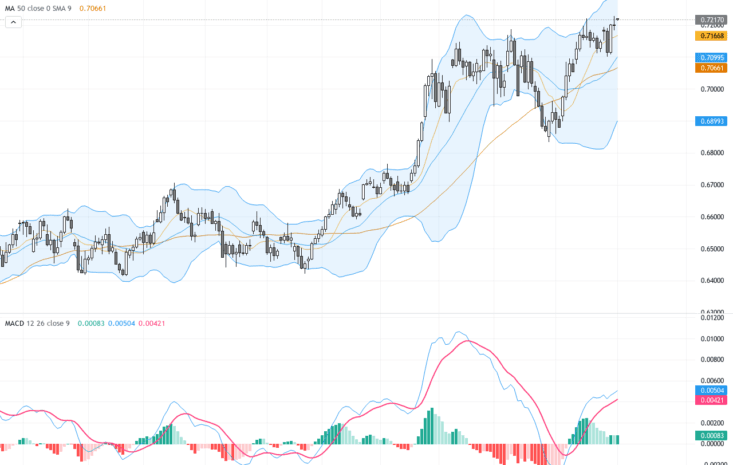
Price Movement
The USD/CAD weekly chart displays a pronounced upward trend, with notable momentum in recent weeks. The price has broken through previous resistance levels and continues to ascend within an upward channel. This aligns with a bullish trend that began in early 2023. Moving averages are converging, reinforcing the bullish sentiment. The price, however, is approaching upper channel boundaries, indicating potential for overextension. This could lead to either a continuation after consolidation or a possible pullback to retest prior support levels. The overall market sentiment appears optimistic, bolstered by increasing volume, suggesting sustained investor interest.
Technical Analysis
- Trend: Strong upward channel, maintaining higher highs and higher lows.
- Moving Averages: Price is above the 50, 100, and 200-week SMAs, indicating a bullish trend.
- MACD: MACD line is above the signal line with increasing histogram bars, reinforcing a bullish momentum.
- Volume: Volume increases on upward moves, confirming the strength of the current trend.
Outlook
The current outlook for USD/CAD is bullish, with strong upward momentum continuing. If the price sustains its stance above critical SMAs, the bullish trend is likely to persist. However, being at the upper channel boundary, caution is advised for potential pullbacks or consolidation phases. The MACD indicator suggests ongoing momentum, but a careful watch on price action near resistance levels is recommended. If price reverts, testing lower support within the channel will be crucial for maintaining the trend. Overall, the atmosphere is positive, yet monitoring for trend reversals or confirmations is essential.
Support and Resistance
| Support Levels | Resistance Levels |
|---|---|
| 1.3880 | 1.3980 |
| 1.3730 | 1.4400 |
| 1.3610 | 1.4670 |