Gold Trend 23/12
2021-12-23 @ 13:47
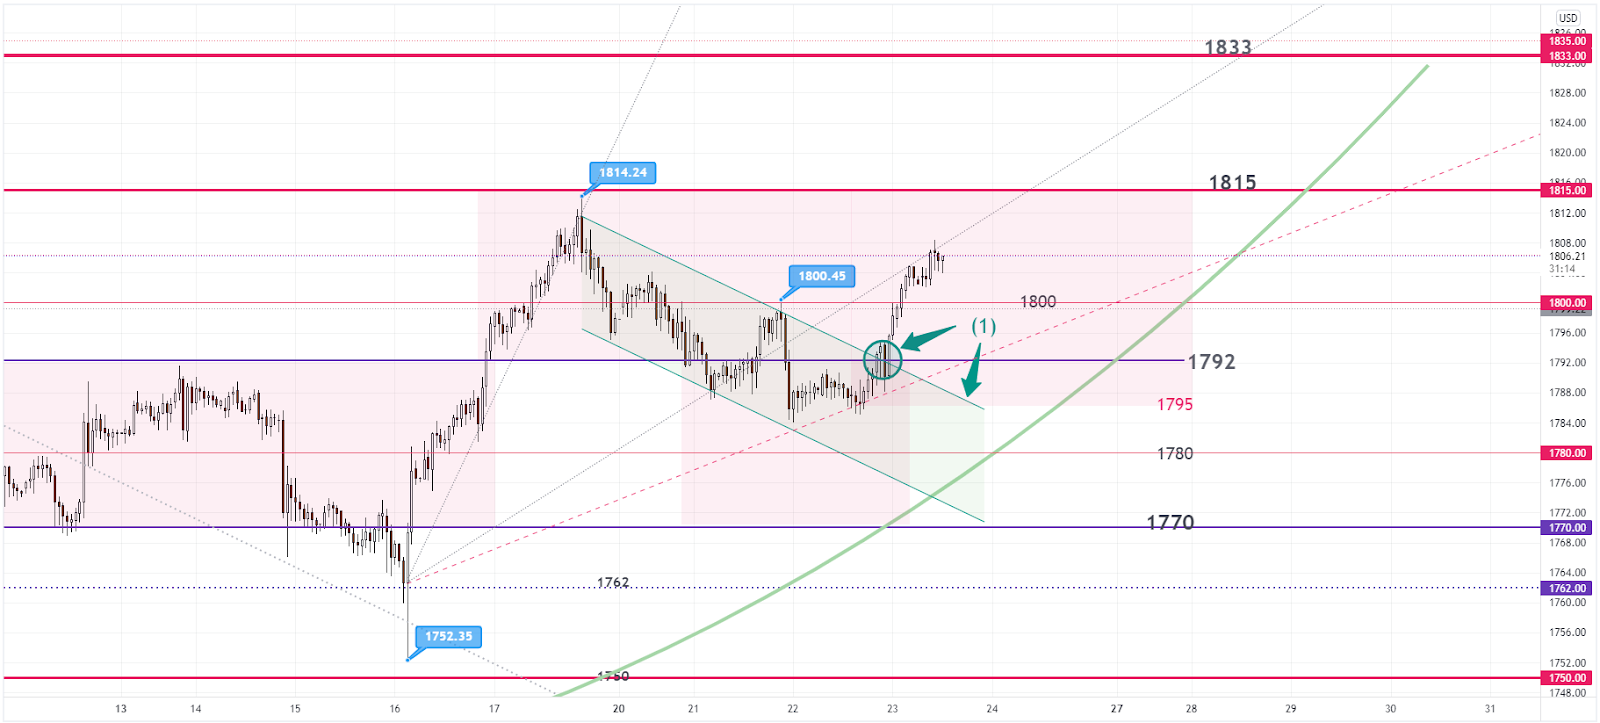
Gold climbed more than USD 10 yesterday. The market opened at1788. The price was bounded by a tight range between 1785-91 during the Asian & European session. At the opening of the US session, volume rushed in. The price broke out from the S-T downtrend channel(1) and the 1792 resistance. It went all the way to day-high 1804 near the day’s end. The market closed at 1803.
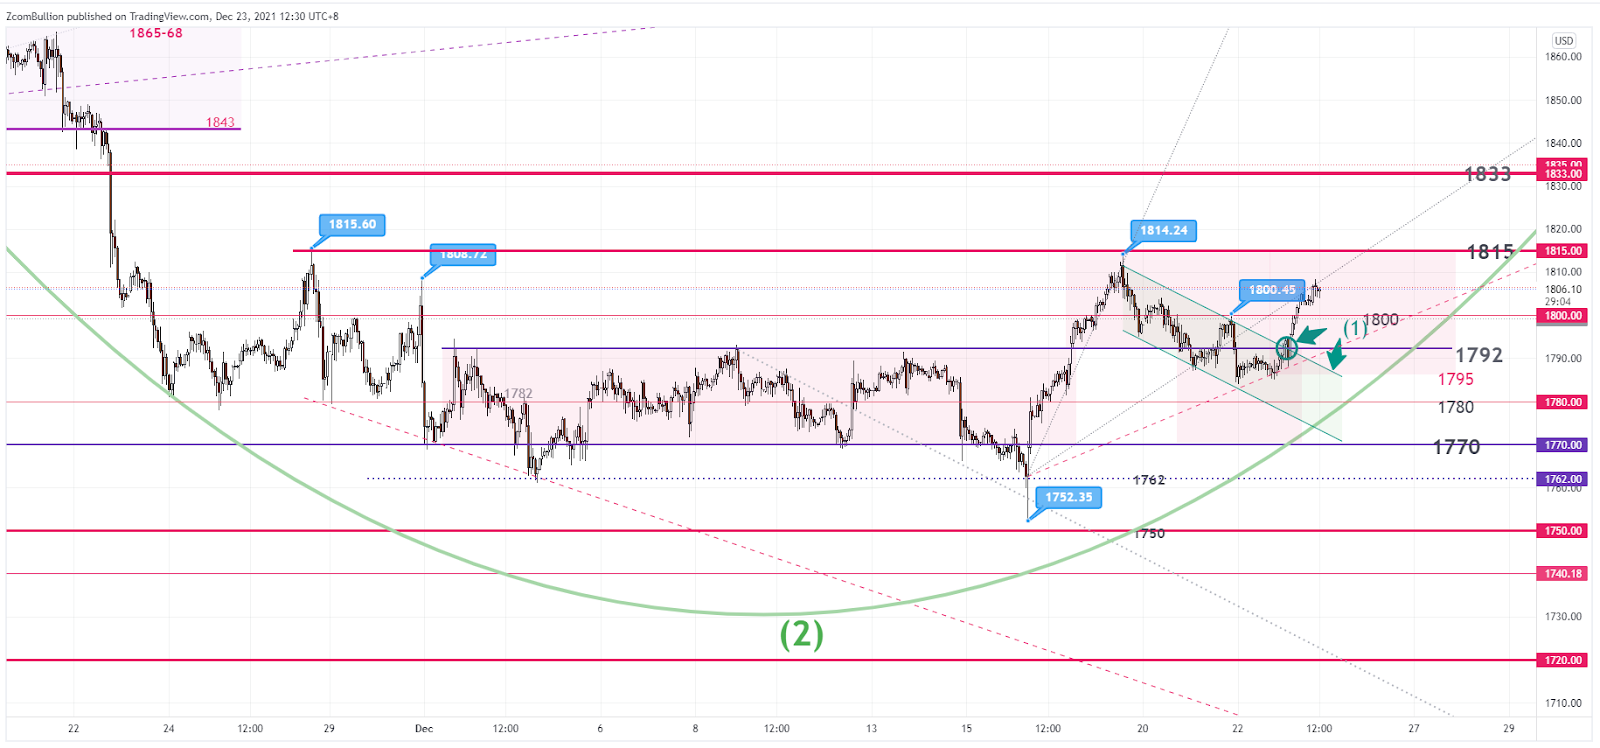
As mentioned in the past few days, a rounding bottom pattern is under development in the 1-hour chart. The rebound began near 1785 yesterday, successfully defended the pattern. Buying is slowly dominating the market. Once the price clears the resistance at 1815, the upside target can be aimed at 1835 or above.
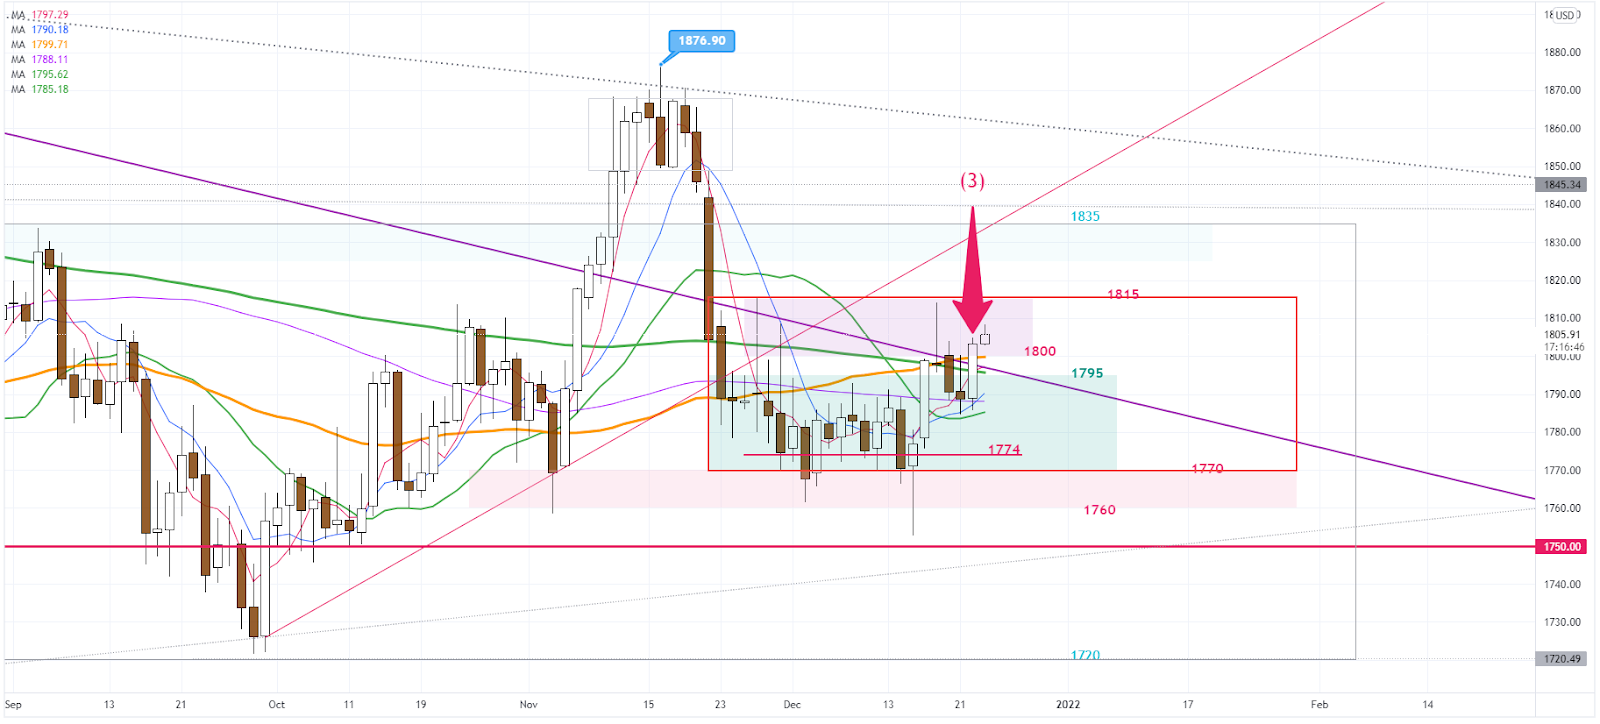
The climb yesterday has swallowed the decline in the last 2 days. It is a sign of the bull as it is the first time in 1 month since Nov. 27 that the price is able to close above 1800(3).
S-T Resistances:
1820
1812-15
1807
Market price: 1805
S-T Supports:
1800-1797
1792
1785
Risk Disclosure: Gold Bullion/Silver (“Bullion”) trading carries a high degree of risk, and may not be suitable for all investors. The high degree of leverage can work against you as well as for you. This article is for reference only and is not a solicitation or advice to trade any currencies and investment products . Before deciding to trade Bullion you should carefully consider your investment objectives, level of experience, and risk appetite. The possibility exists that you could sustain a loss of some or all of your initial investment or even more in extreme circumstances (such as Gapping underlying markets) and therefore, you should not invest money that you cannot afford to lose. You should be aware of all the risks associated with trading Bullion, and seek advice from an independent financial advisor if you require. Client should not make investment decision solely based on the point of view and information on this article.