Gold Trend 18/08
2022-08-18 @ 16:28
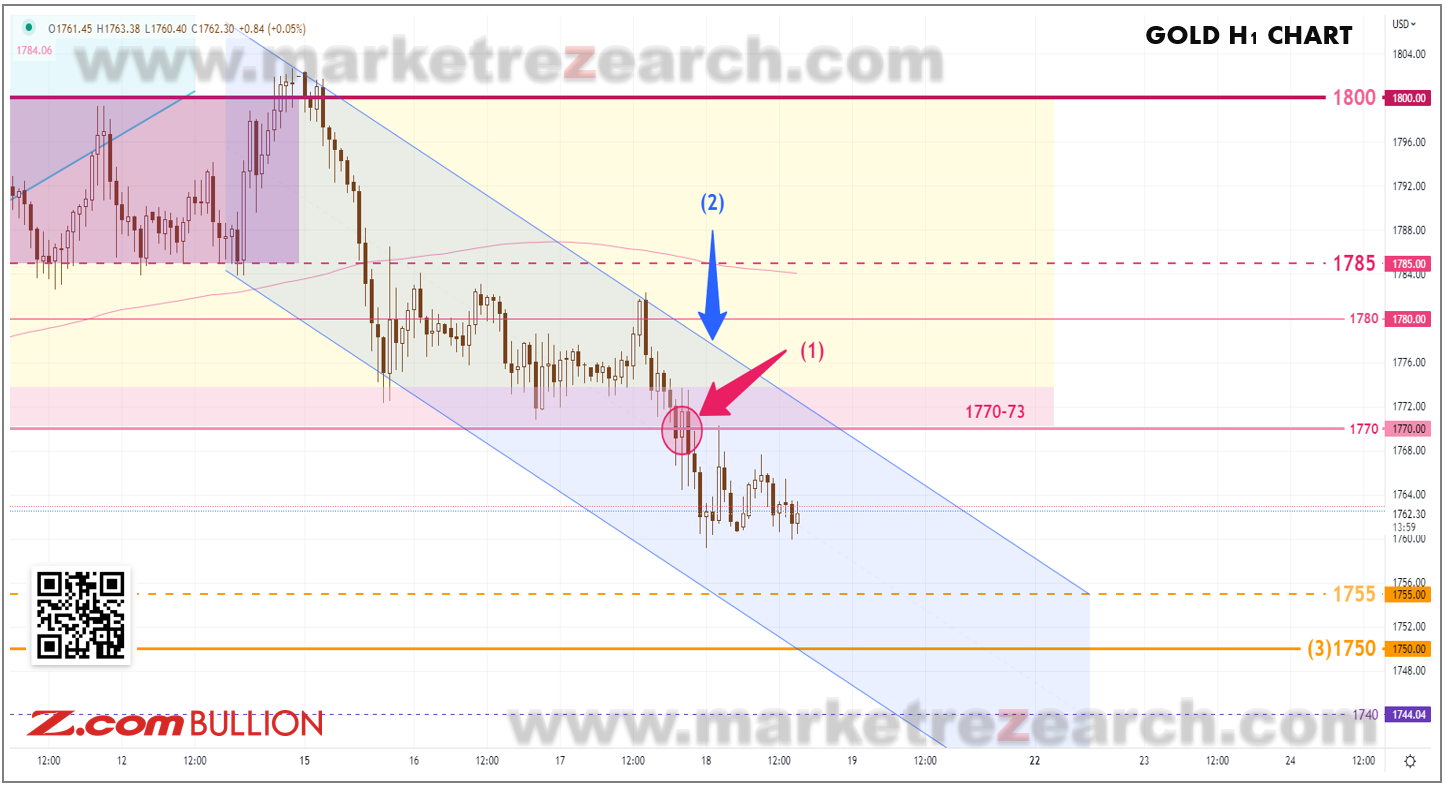
Gold cleared the 1770 support yesterday. The day began at 1775. The price first touched the day-high at 1782 during the Asian trading and eased toward 1770 after that. It dropped below 1770(2) at the US session, touching the day-low near 1759, with the day ending at 1861.
An S-T downtrend channel(2) has formed on the 1-hour chart in the past 48 hours. After the price broke the support at 1770, the trend remained bearish, with the downside target pointing at 1750.
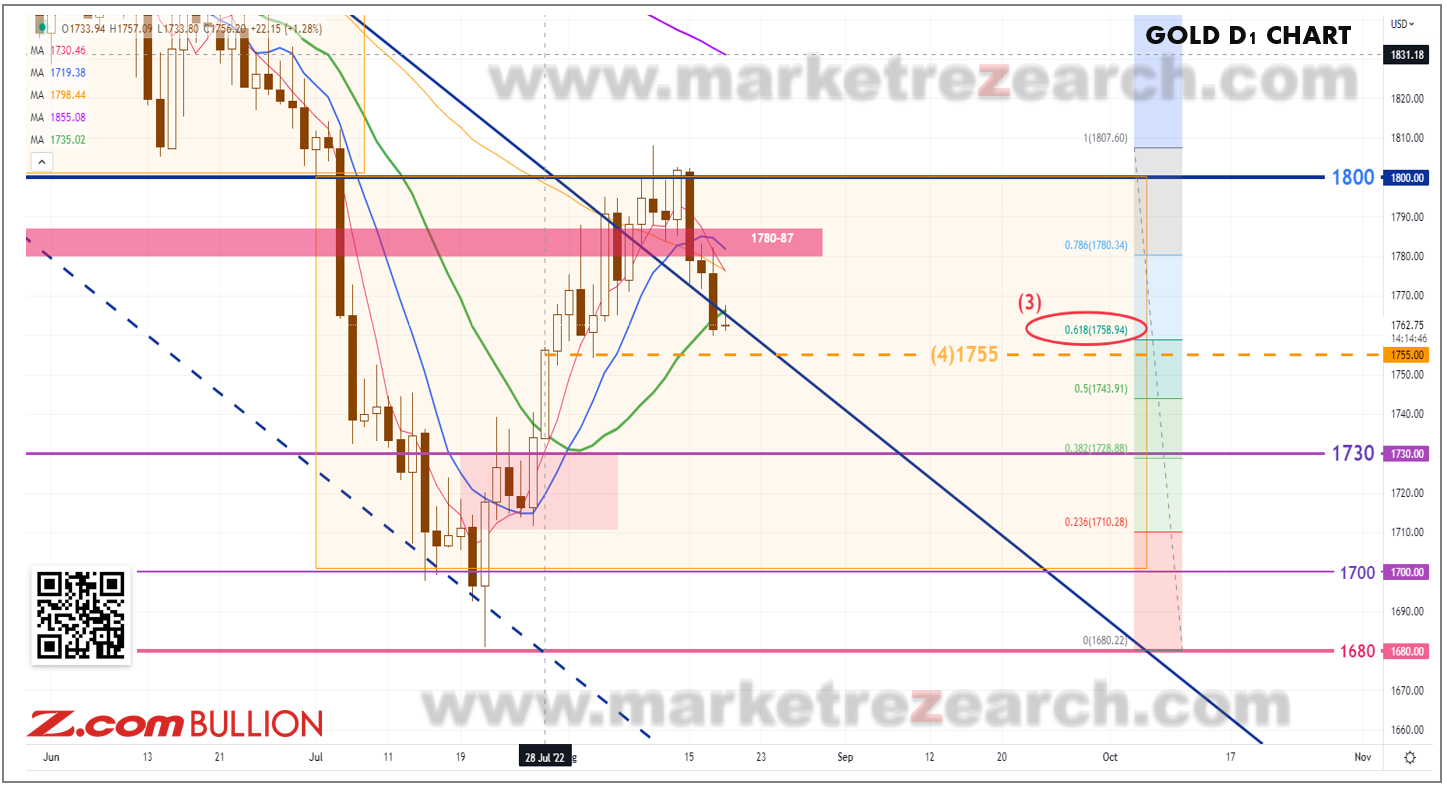
The price touched our 1st target at 1758(3) yesterday. As the price went below the 20 days MA, the consolidation period has yet to end; the next downside target is now at 1755(4).
S-T Resistances:
1775-73
1770
1765
Market price: 1762
S-T Supports:
1759-60
1755
1750
Risk Disclosure: Gold Bullion/Silver (“Bullion”) trading carries a high degree of risk, and may not be suitable for all investors. The high degree of leverage can work against you as well as for you. This article is for reference only and is not a solicitation or advice to trade any currencies and investment products . Before deciding to trade Bullion you should carefully consider your investment objectives, level of experience, and risk appetite. The possibility exists that you could sustain a loss of some or all of your initial investment or even more in extreme circumstances (such as Gapping underlying markets) and therefore, you should not invest money that you cannot afford to lose. You should be aware of all the risks associated with trading Bullion, and seek advice from an independent financial advisor if you require. Client should not make investment decision solely based on the point of view and information on this article.